Municipal
Perspective published on March 11, 2021
Still Work To Do for Many Municipal Issuers after Credit-Positive American Rescue Plan
Summary
- The American Rescue Plan is a credit positive for municipal bonds.
- It is likely to mitigate the pace of ratings agency downgrades over the next 12 to 24 months.
- Nevertheless, the plan largely amounts to a one-time infusion of funds; financial imbalances are likely to reemerge in FY 23 and beyond if federal support wanes.
The Senate and House of Representatives passed, and President Biden signed the version of the $1.9 trillion American Rescue Plan Act of 2021 (ARP). The ARP is a significant credit positive for municipals, and it may create momentum for a large infrastructure package later this year. Municipal credit quality moving forward is likely to diverge across issuers. Issuers that deploy federal funds substantially for one-time needs (like pre-paying debt, financing capital projects, or capitalizing a reserve) are likely to prove more resilient over time. The current degree of federal support is likely to wane, and issuers that aggressively spend this year’s extraordinary one-time federal dollars on permanent tax cuts or new programs risk creating future budget deficits.
Details of the ARP
The ARP is the largest of the three major pandemic-era stimulus bills in terms of its direct impact on municipal credit. The legislation appropriates roughly $570 billion for aid to municipal issuers (See Figure 1). Among other things, this includes $195 billion in aid to states, $130 billion for local governments, and $31 billion for mass transit providers, including $6 billion for the New York Metropolitan Transit Authority (NYMTA).
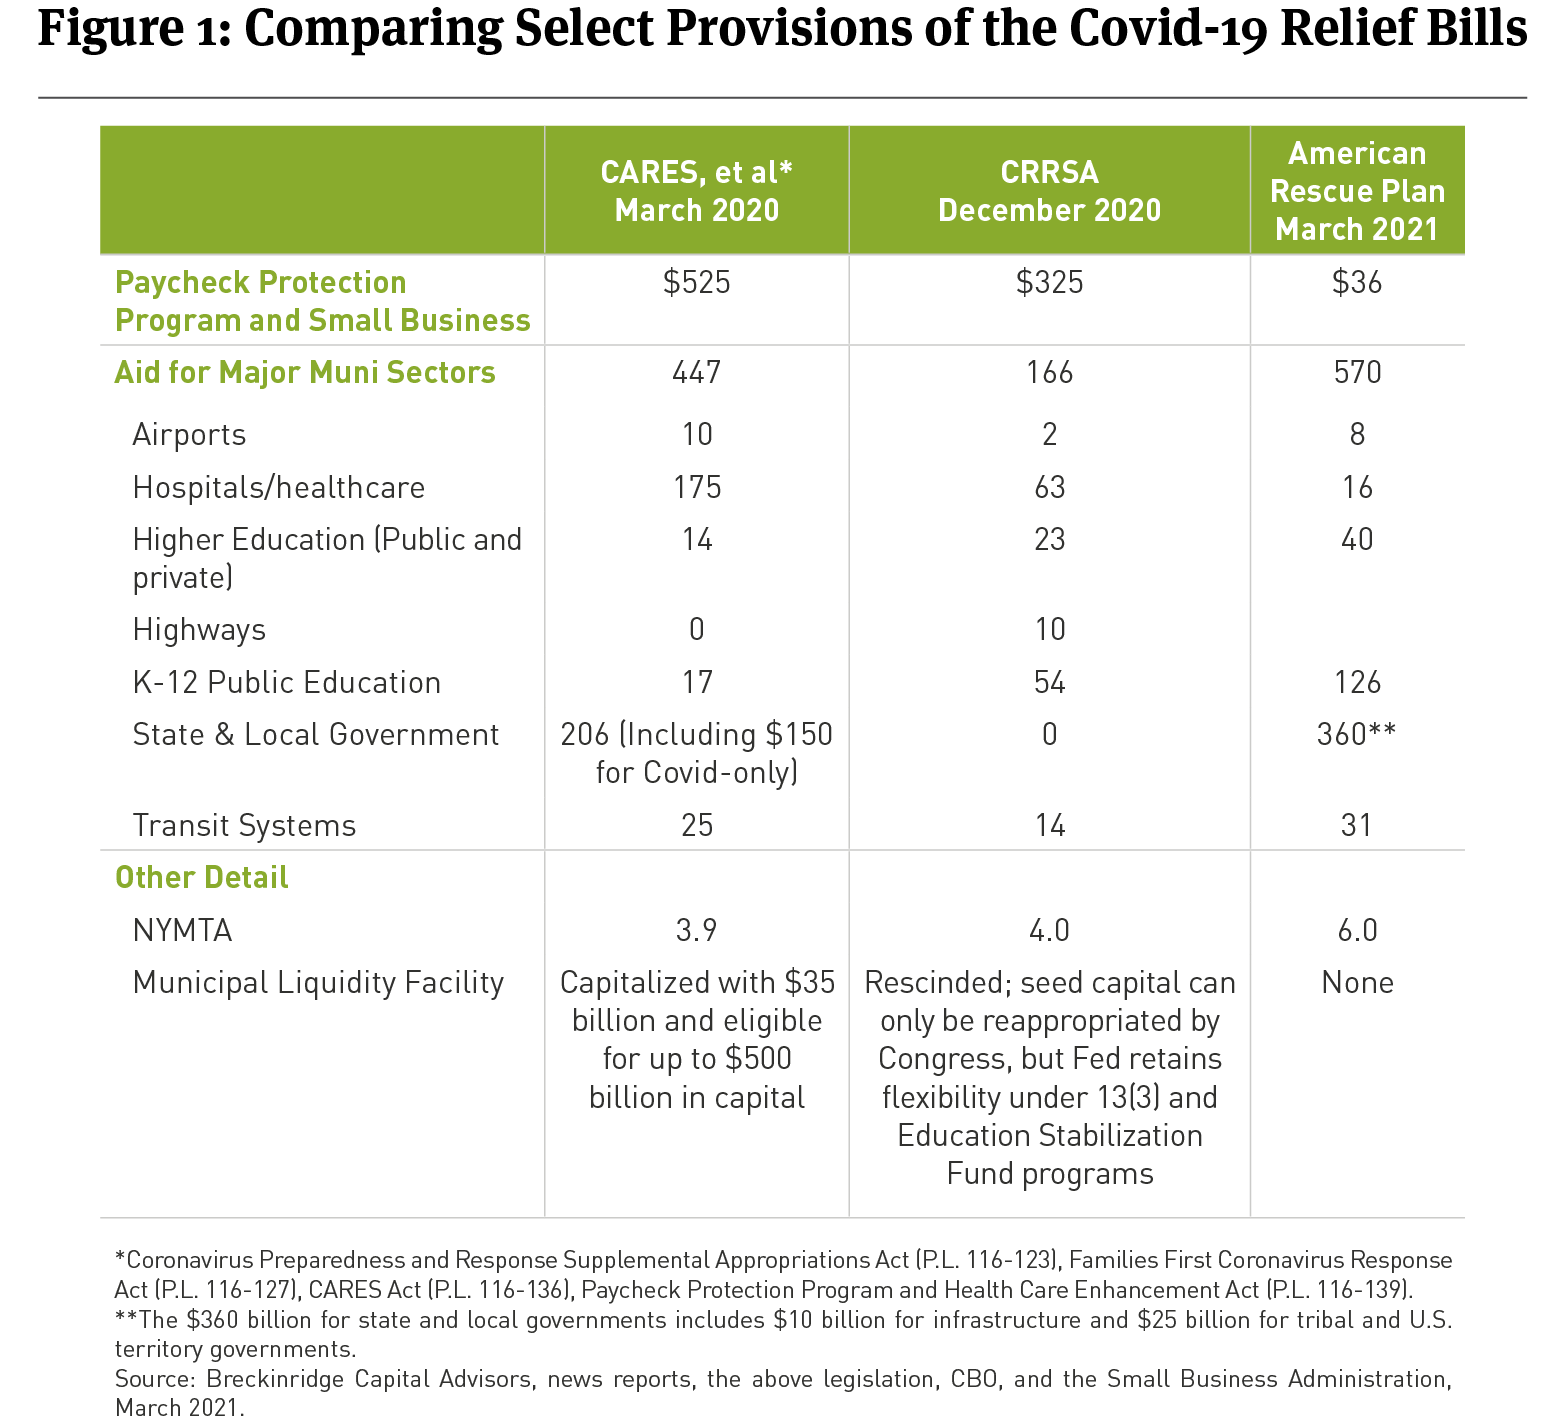
Airports will get another $8 billion, and states that opt to expand Medicaid under the Affordable Care Act could receive $16 billion in increased matching grants.
Ostensibly, the ARP restricts federal aid to pandemic-related costs or revenue losses. It explicitly bars funds from being used to finance tax cuts or pension-funding.1 However, the language around these requirements is loose, and it is unclear whether the Treasury could enforce these provisions, politically. In practice, the aid is likely to be fungible.
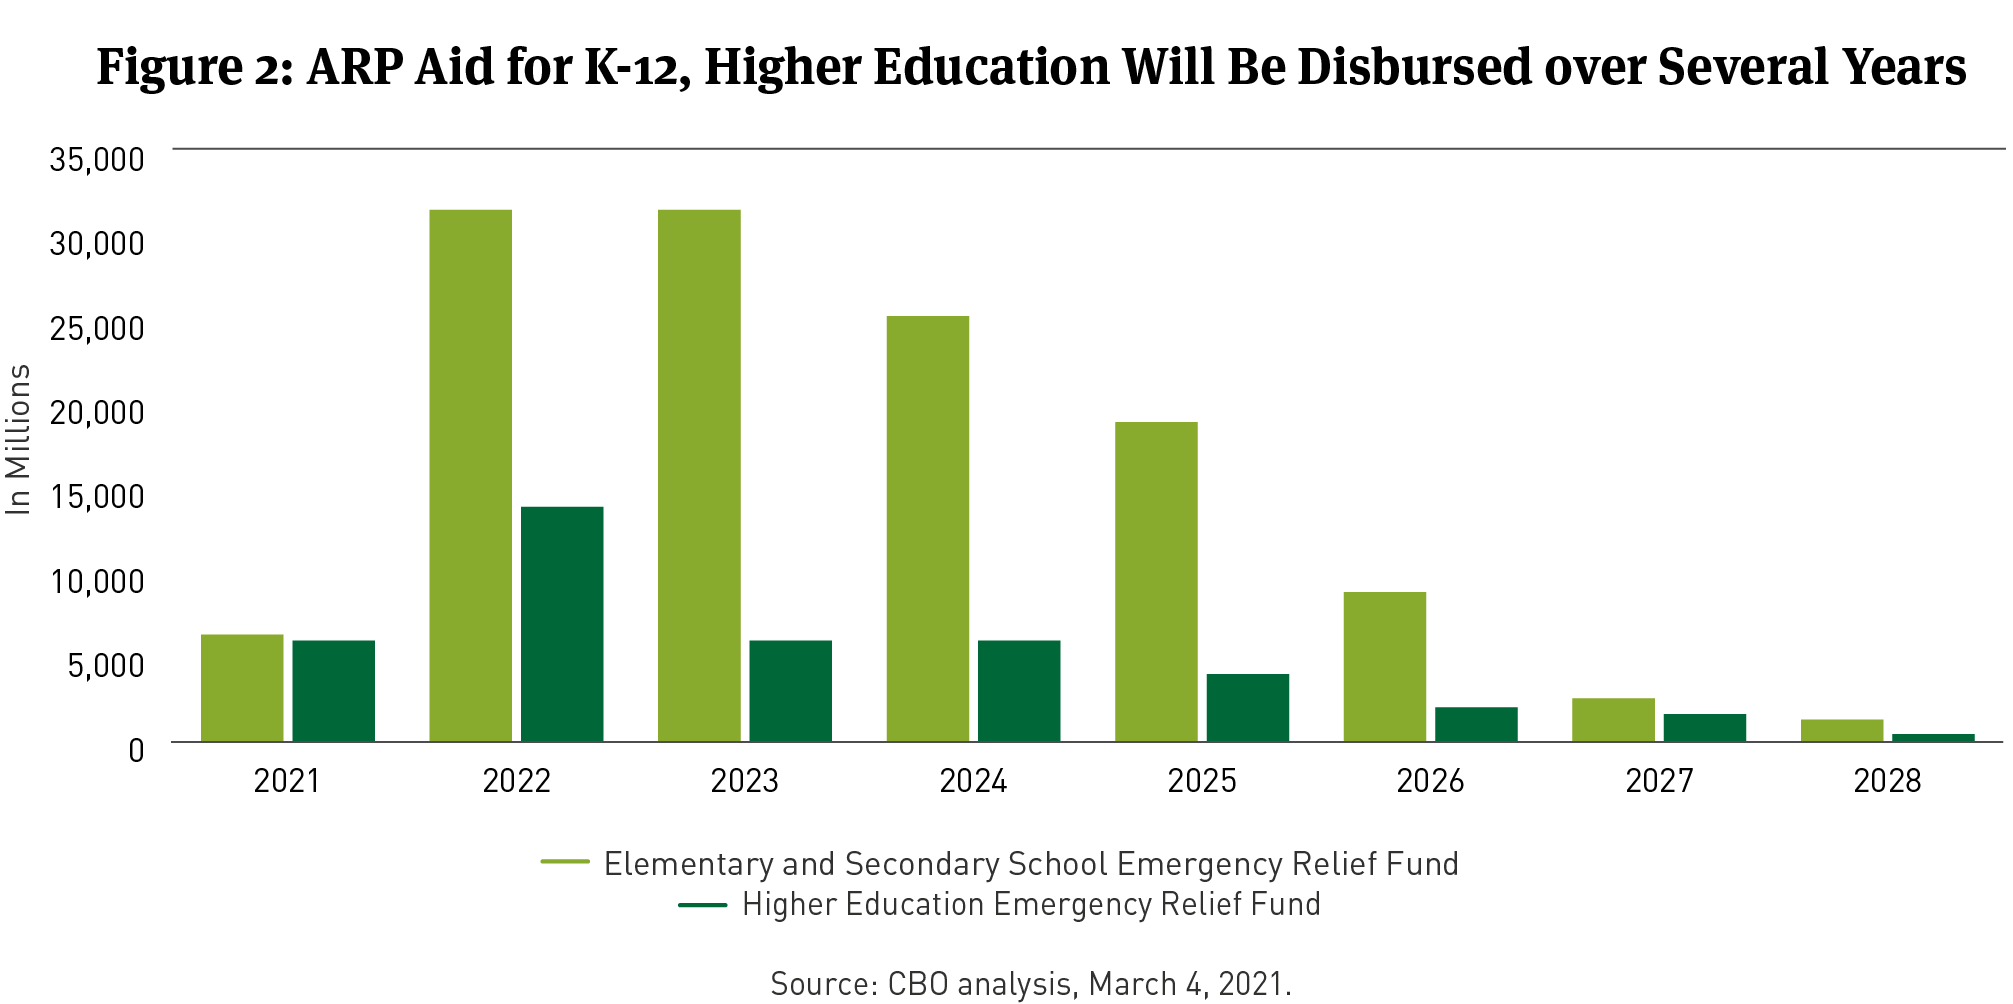
The ARP is particularly helpful for k-12 public and higher education providers. It provides $126 billion to public elementary and secondary schools and $40 billion for public and private higher education. The money is disbursed over multiple years (See Figure 2).
The ARP also extends or increases various CARES Act benefits for individuals and businesses. This includes extending enhanced unemployment benefits through September and sending Americans another round of direct checks ($1,400 payments to individuals and households earning $75,000 and $150,000 or less, respectively). It also includes a significant one-year expansion of the child tax credit and a $29 billion support fund for the restaurant industry.
Credit Impact
The ARP is likely to mitigate the pace of ratings agency downgrades over the next 12 to 24 months. It may also increase the likelihood for out-year deficits as some issuers use ARP funds to finance tax cuts or expand ongoing programs. Since late December, most public finance sectors have carried negative outlooks at both S&P and Moody’s excepting housing, utilities, and toll roads. However, the sheer scale of the ARP is likely to overwhelm near-term structural credit weakness for many issuers. Agencies may move more sectors to stable. Of note: on March 9, S&P removed the negative outlook on Illinois’ BBB- rating because “economic conditions, federal support, and administrative actions have pulled the rating away from the speculative-grade category” (emphasis added).2
For perspective, the ARP’s state, local, and k-12 public education aid alone is equivalent to 25 percent of 2019 state and local tax revenue3. In combination with previous aid packages since last March, state and local governments have now received federally provided support equivalent to 40 percent of 2019 tax revenue. Each state’s fiscal condition is a bit different, of course. But we estimate that the ARP’s non-school provisions will deliver each state between 9% and 22% of its 2019 own-source state and local government revenue. This figure includes of all revenue sources, not just tax revenue.4
Aid is flowing despite surprisingly resilient pandemic-era revenue performance. Tax revenues have outperformed initial budget estimates in most states, and recent estimates suggest state collections declined by only 0.1 percent in calendar year 2020 compared to 2019.5
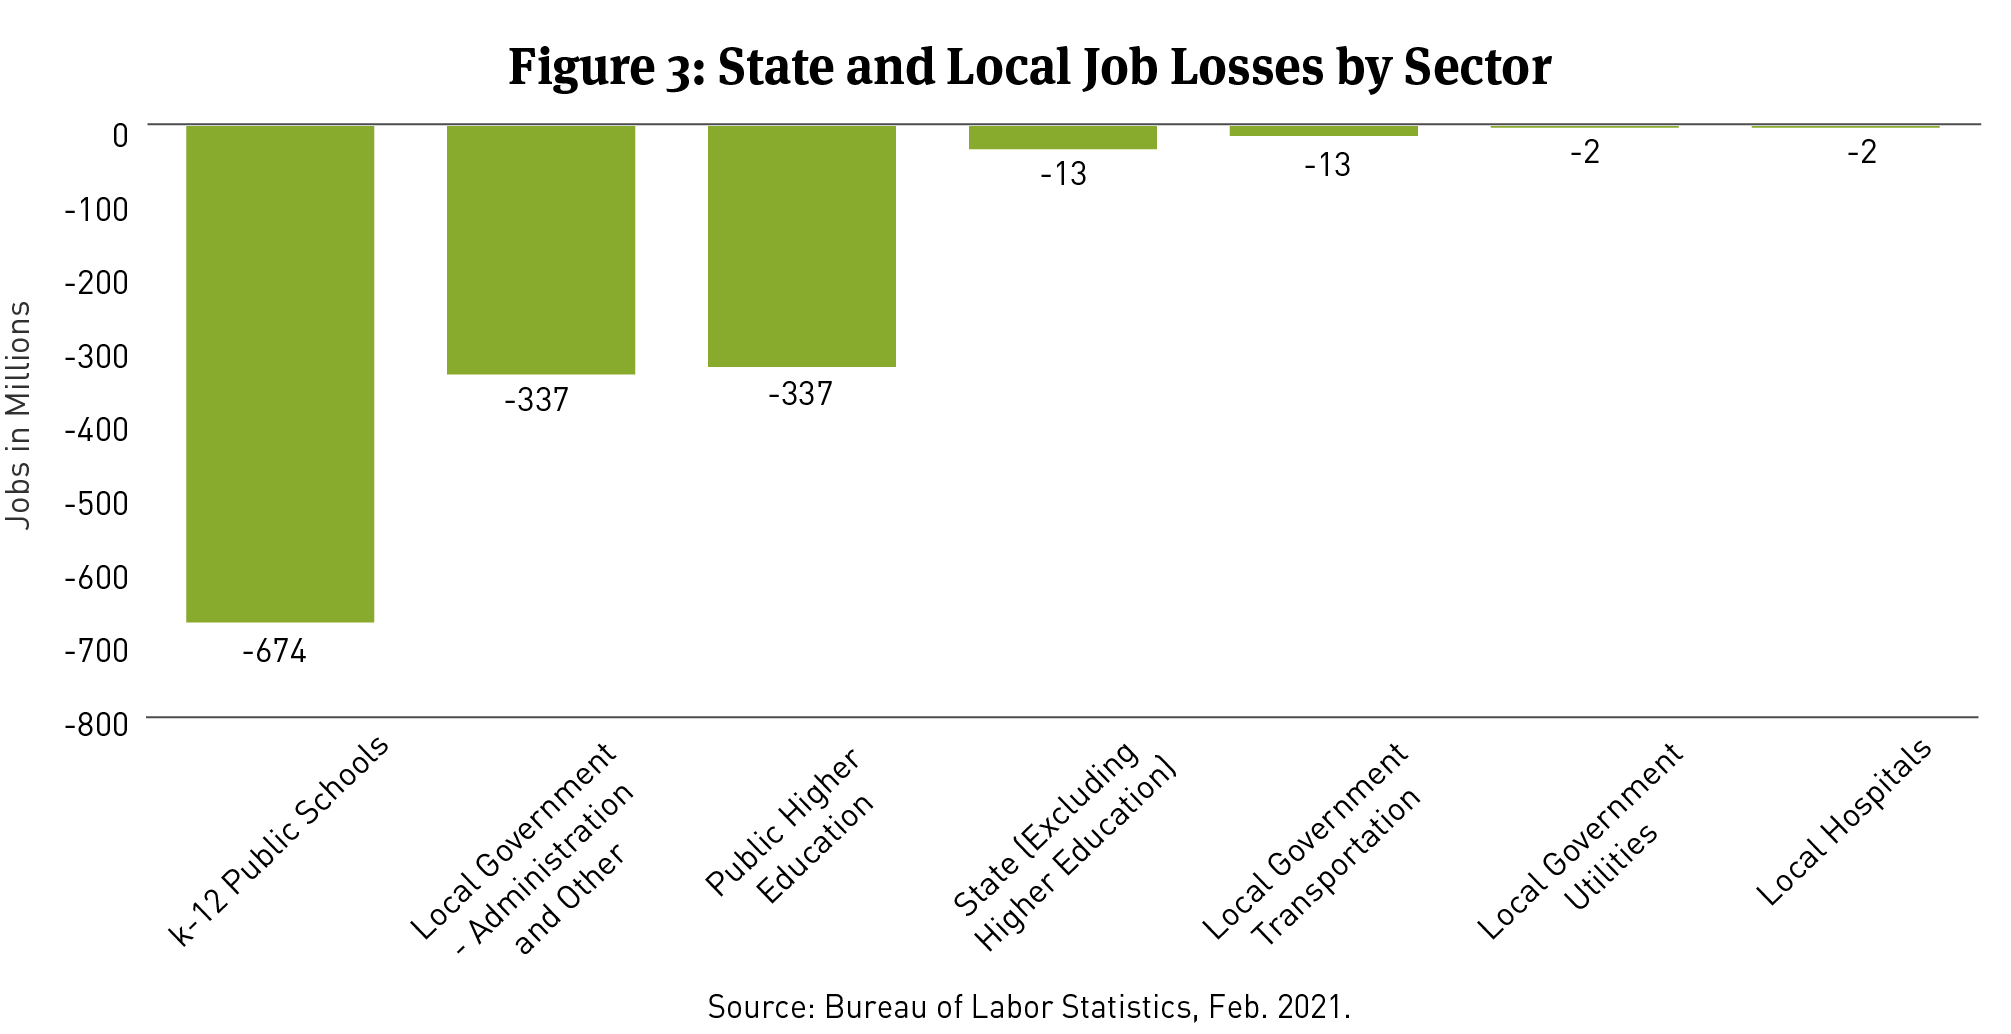
Public sector employment declines may also be overstated. As Figure 3 illustrates, most of the nation’s 1.4 million state and local job-losses have been concentrated in the k-12 public schools and higher education sectors. These job-losses likely reflect the move to remote learning more than outright budget stress.6 Education jobs may return relatively quickly once schools can reopen safely.
Municipal issuers are also likely to benefit from the ARP’s provisions for individuals and businesses. Payments to individuals and businesses buoyed local income and consumption taxes during summer 2020. They are likely to do so, again.
ARP aid will also be extremely helpful for transportation issuers. Mass transit providers will receive $31 billion from the legislation., Cumulatively, federal aid for mass transit will total roughly $70 billion from March 2020 through March 2021. That compares to $11.7 billion in federal grant aid in 2019. There is still a long way to go for mass transit issuers, which continue to report significant declines in daily ridership, but federal support should help stabilize near-term liquidity for most.
Successfully enacting the ARP may also create momentum for an infrastructure bill later this year. House and Senate Democrats now know how to organize their caucuses to pass a large, complex reconciliation bill. They are probably marginally more likely to seek the same path for President Biden’s $2 trillion infrastructure proposal.
The details of Biden’s infrastructure plan remain murky, but any new package would likely increase highway trust fund allotments, bolster grants for clean water and drinking water revolving loan funds, and reinstate advance refundings and Build America Bonds, among other priorities. The plan would also likely include some type of support for climate-related initiatives at the state and local levels.
Still not out-of-the-woods
Notwithstanding the ARP’s positive credit impact, we believe Breckinridge’s bottom-up approach to credit analysis remains essential. It is a near-certainty that some muni issuers will overly rely on federal aid to close near-term budget deficits. For example, New Jersey’s proposed fiscal year (FY) 2022 budget is structurally unbalanced and relies on borrowed funds to close a general fund deficit equal to 7 percent of revenue. Federal aid will help New Jersey close next year’s budget gap, but deficits will reemerge in FY 23. San Francisco’s planned deficits in FY 22 and FY 23 are also likely to be “plugged” with federal aid. While San Francisco remains a strong credit, it too, will face difficult budget decisions in the future. Given the large infusion of federal cash, voters and elected officials are less likely to support balancing operations with tax hikes and spending cuts.
Pension stress and deferred capital maintenance will also remain challenges for some issuers. In the same week that S&P removed Illinois’ negative outlook, Moody’s Investors Service noted that its pension debt had grown to over $300 billion or 37% of gross state product.8 Clark County, Nevada has deferred capital spending to help balance its pandemic-era budgets, and New York State is considering reducing its pay-go capital spending, as well.9
Importantly, some issuers may now be overly dependent on federal support. For example, he NYMTA has now received $14 billion in federal assistance over the past 12 months. That amount of aid is unlikely to be sustained. But the NYMTA has yet to identify revenue and expenditure reforms that will permanently stabilize its long-term finances. Washington’s appetite for spending may wane faster than the market expects. Investors are beginning to worry (slightly) more about inflation. The 10-year Treasury rate has jumped above 1.5 percent in recent weeks. That is a low rate by historical standards, but it is higher than the borrowing rate the Congressional Budget Office (CBO) expected for this year. The CBO did not anticipate a 1.5 percent 10-year rate until 2023. Absent strong and sustained gross domestic product growth, rising yields could pressure the federal debt higher and weaken lawmakers’ willingness—and, possibly, their ability–to support more spending.
Finally, political dynamics can change quickly. It is worth recalling that had Republicans won just one of Georgia’s two Senate races on January 6, the credit outlook for the muni market would be much darker. The Georgia elections, by themselves, may have kept the NYMTA an investment grade credit and forestalled downgrades for several states. A Republican Senate likely would have been much less generous to mass transit or state and local governments. As such, Breckinridge will continue to focus on credits that can finance themselves ably without external assistance.
[1] H.R. 1319, American Rescue Plan, Subtitle M, Sec. 9901. Coronavirus State and Local Fiscal Recovery Funds. For example, an issuer could fund increased pension contributions by using American Rescue Plan dollars to pay for planned capital needs, and then, redirect existing capital dollars to a pension system. Alternatively, an issuer could issue pension obligation bonds to capitalize its pension system, and then, use American Rescue Plan funds to repay the bonds. (This would likely be characterized as repayment of debt, not an outright contribution to a pension system). The pension restriction language in the American Rescue Plan lacks any clause regarding the “substance” of the transaction. It merely states that “no state or territory may use funds made available under this section for deposit into any pension fund.” (emphasis added by Breckinridge).
[2] “State of Illinois Debt Rating Outlook Revised to Stable from Negative on Better-than-expected Performance,” Standard & Poor’s, March 9, 2021.
[3] Breckinridge analysis of the American Rescue Plan and Bureau of Economic Analysis figures.
[4] Breckinridge analysis of American Rescue Plan, 2018 Census of Governments, and Tax Foundation data, March 2021.
[5] Reason Foundation analysis, February 4, 2020. Available at: https://reason.org/commentary/initial-2020-revenue-figures-in-many-states-are-higher-than-expected/.
[6] Chad Aldeman, “During the pandemic, “lost” education jobs aren’t what they seem,” Brookings Institution, March 2, 2021. Available at: https://www.brookings.edu/blog/brown-center-chalkboard/2021/03/02/during-the-pandemic-lost-education-jobs-arent-what-they-seem/
[7] Lucy Dadayan and Kim Rueben, “Why States and Localities Need More Federal Aid,” Tax Policy Center (Urban Institute & Brookings Institution), February 22, 2021. Available at: https://www.taxpolicycenter.org/taxvox/why-states-and-localities-need-more-federal-aid.
[8] “Adjusted net pension liability to surpass $300 billion as source of credit stress worsens,” Moody’s Investors Service, March 2, 2021.
[9] “Debt-based budget relief maneuvers may defer and amplify fiscal challenges,” Moody’s Investors Service, March 3, 2021.
DISCLAIMER
This material provides general and/or educational information and should not be construed as a solicitation or offer of Breckinridge services or products or as legal, tax or investment advice. The content is current as of the time of writing or as designated within the material. All information, including the opinions and views of Breckinridge, is subject to change without notice.
Any estimates, targets, and projections are based on Breckinridge research, analysis, and assumptions. No assurances can be made that any such estimate, target or projection will be accurate; actual results may differ substantially.
Past performance is not a guarantee of future results. Breckinridge makes no assurances, warranties or representations that any strategies described herein will meet their investment objectives or incur any profits. Any index results shown are for illustrative purposes and do not represent the performance of any specific investment. Indices are unmanaged and investors cannot directly invest in them. They do not reflect any management, custody, transaction or other expenses, and generally assume reinvestment of dividends, income and capital gains. Performance of indices may be more or less volatile than any investment strategy.
Performance results for Breckinridge’s investment strategies include the reinvestment of interest and any other earnings, but do not reflect any brokerage or trading costs a client would have paid. Results may not reflect the impact that any material market or economic factors would have had on the accounts during the time period. Due to differences in client restrictions, objectives, cash flows, and other such factors, individual client account performance may differ substantially from the performance presented.
All investments involve risk, including loss of principal. Diversification cannot assure a profit or protect against loss. Fixed income investments have varying degrees of credit risk, interest rate risk, default risk, and prepayment and extension risk. In general, bond prices rise when interest rates fall and vice versa. This effect is usually more pronounced for longer-term securities. Income from municipal bonds can be declared taxable because of unfavorable changes in tax laws, adverse interpretations by the IRS or state tax authorities, or noncompliant conduct of a bond issuer.
Breckinridge believes that the assessment of ESG risks, including those associated with climate change, can improve overall risk analysis. When integrating ESG analysis with traditional financial analysis, Breckinridge’s investment team will consider ESG factors but may conclude that other attributes outweigh the ESG considerations when making investment decisions.
There is no guarantee that integrating ESG analysis will improve risk-adjusted returns, lower portfolio volatility over any specific time period, or outperform the broader market or other strategies that do not utilize ESG analysis when selecting investments. The consideration of ESG factors may limit investment opportunities available to a portfolio. In addition, ESG data often lacks standardization, consistency and transparency and for certain companies such data may not be available, complete or accurate.
Breckinridge’s ESG analysis is based on third party data and Breckinridge analysts’ internal analysis. Analysts will review a variety of sources such as corporate sustainability reports, data subscriptions, and research reports to obtain available metrics for internally developed ESG frameworks. Qualitative ESG information is obtained from corporate sustainability reports, engagement discussion with corporate management teams, among others. A high sustainability rating does not mean it will be included in a portfolio, nor does it mean that a bond will provide profits or avoid losses.
Net Zero alignment and classifications are defined by Breckinridge and are subjective in nature. Although our classification methodology is informed by the Net Zero Investment Framework Implementation Guide as outlined by the Institutional Investors Group on Climate Change, it may not align with the methodology or definition used by other companies or advisors. Breckinridge is a member of the Partnership for Carbon Accounting Financials and uses the financed emissions methodology to track, monitor and allocate emissions. These differences should be considered when comparing Net Zero application and strategies.
Targets and goals for Net Zero can change over time and could differ from individual client portfolios. Breckinridge will continue to invest in companies with exposure to fossil fuels; however, we may adjust our exposure to these types of investments based on net zero alignment and classifications over time.
Any specific securities mentioned are for illustrative and example only. They do not necessarily represent actual investments in any client portfolio.
The effectiveness of any tax management strategy is largely dependent on each client’s entire tax and investment profile, including investments made outside of Breckinridge’s advisory services. As such, there is a risk that the strategy used to reduce the tax liability of the client is not the most effective for every client. Breckinridge is not a tax advisor and does not provide personal tax advice. Investors should consult with their tax professionals regarding tax strategies and associated consequences.
Federal and local tax laws can change at any time. These changes can impact tax consequences for investors, who should consult with a tax professional before making any decisions.
The content may contain information taken from unaffiliated third-party sources. Breckinridge believes such information is reliable but does not guarantee its accuracy or completeness. Any third-party websites included in the content has been provided for reference only. Please see the Terms & Conditions page for third party licensing disclaimers.