Corporate
Commentary published on July 11, 2022
Q3 2022 Corporate Bond Market Outlook
Summary
- During the second quarter, the Federal Reserve (Fed) raised the fed funds rate by 1.25 percent (125 basis points (bps)).
- The Fed’s intention to address inflation, even at the risk of recessionary economic conditions, helped to sustain the volatile and risk-off investment market environment of the first quarter.
- Globally, government bonds losses during the first six months of 2022 were among the most significant on record. (1)
- Corporate bonds (2) and stocks (3) also recorded losses that were among the worst in 30 and 50 years, respectively.
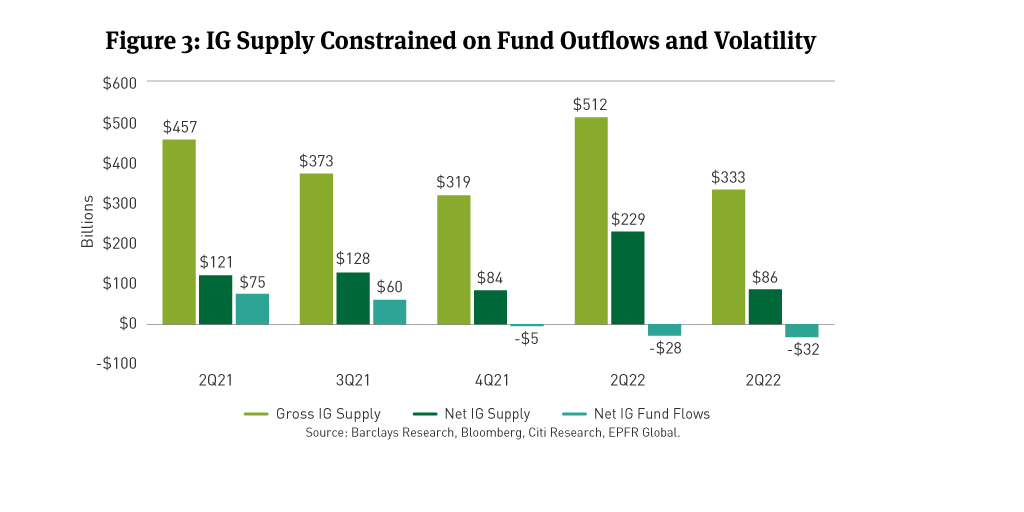
- With tighter financial conditions, IG fixed-rate supply of $333 billion was materially lower than the prior quarter and the same quarter in 2021.(4) IG fund flows were negative by about $32 billion.(5)
- Environmental, social, and governance (ESG) risks in corporate reporting and performance continued to rise. A survey of the Securities and Exchange Commission (SEC) filings of 50 Fortune 100 companies found commentary on the increase on seven material ESG subjects.(6)
Investment Review and Outlook
Fed interest rate policy turns more hawkish, June fed fund rate increase is largest in 40 years
Continuing its intention to slow economic growth through tighter monetary policies, the Federal Open Market Committee (FOMC) increased the fed funds rate by a quarter percentage point at its early-May meeting.
On May 27, the Commerce Department’s Bureau of Economic Analysis report showed the personal consumption expenditures (PCE) price index, the Fed's preferred inflation indicator jumped 6.3 percent on an annual basis in April, after a 6.6 percent increase in March.
The FOMC responded with the 75bps fed funds rate increase at its June meeting. In comments after the meeting, Fed Chair Powell was clearly focused on inflation control, even if tighter monetary policy might lead to recessionary pressures.
While the root causes of the inflationary environment—price inflation driven by economic growth and fueled by government stimulus, product shortages, and Russia’s invasion of Ukraine—have not changed, talk of a potential recession in the U.S. sent equity and bond markets into another spasm of volatility during the quarter.
According to Bloomberg, U.S. Treasury Bonds fell 3.78 percent on the quarter, while the broad Bloomberg Aggregate U.S. Bond Index was off 4.69 percent. Equities, as measured by the S&P 500 Index, ended the quarter about 16 percent7 lower.
The Bloomberg U.S. Corporate IG Bond Index (the Index) spread widened by 40bps between March 31 and June 30, ending the quarter at 155bps. The Index recorded a quarterly loss of 7.26 percent on a total return basis and a negative excess return of 2.24 percent.
While corporate credit fundamentals remain solid, global events and economic trends hold the potential of tilting credit rating trends to a negative posture. “The confluence of the Russia-Ukraine military conflict, nagging inflation and the prospects for higher interest rates, and the lingering pandemic mark a turn in the positive credit momentum of the past 14 months,” S&P rating recently reported. “But while downgrades are now outpacing upgrades, ratings remain resilient overall, and pressure is mounting unevenly.”8
For the quarter, IG corporate bond issuance was $333 billion, according to Bloomberg data. Net issuance during the same period was $86 billion. IG fund flows reflected the concerns of the investment markets, totaling $32 billion in outflows, as reported by EPFR.
Fundamentals
IG Balance Sheet Strength has Improved Over the Past Year
For IG issuers, for the trailing 12-months earnings before interest, taxes, depreciation and amortization (EBITDA) and total debt growth have averaged 17 percent and 3 percent, respectively.9
The recovery in corporate cash flows and earnings drove gross leverage down to 2.1 times from 2.4 times over the past year (See Figure 1).

However, leverage troughed at the end of 2021 and with earnings growth slowing, debt metrics may drift higher prospectively. A drop in merger volumes (down by 17 percent y/y) and a moderation in debt-funded deals is credit-positive and a partial offset to slowing earnings.10 Supply chain strains, elevated input costs, and labor and wage issues are proving to be stickier than expected and may weigh on profit margins.
IG Rating Agency Outlooks are Tilting Negative After a Positive Period
As the economy recovered, S&P upgraded more IG issuers than it downgraded during 1H22 and in 2021. That posture is shifting.
S&P negative credit rating outlooks and watch-listings are running at nearly 2:1, relative to positive outlooks and watch-listings (See Figure 2).11

With outlooks and watch-listings driving rating changes over time, S&P sees a higher risk of net credit deterioration in the IG sector.
Technicals
IG Supply Underwhelmed as Fund Flows Remained Negative
IG fixed-rate gross and net bond issuance of $333 billion and $86 billion, respectively in 2Q22 dropped from $512 billion and $229 billion in 1Q22.12
IG bond funds reported net outflows of $32 billion in 2Q22 compared to $28 billion of outflows in 1Q22 and $74 billion of inflows in 2Q21.13
We expect the new issue market to remain choppy until fund flows stabilize and interest rate and spread volatility begin to ebb (See Figure 3).
Valuations
IG Spreads Widened but Remain Tight Compared to Prior Slowdowns
The IG Corporate Index was 39bps wider in 2Q22. Bonds rated A and those rated BBB were 32bps and 50bps wider, respectively.
At 155bps, IG spreads are below peaks experienced during prior post-Great Financial Crisis U.S. economic slowdowns.14
We continue to expect volatility and a slight widening bias in IG corporate spreads based on inflation pressures, a hawkish Fed, and a slowing economy (See Figure 4).

ESG Spotlight
We continue to see growth in reporting on key ESG issues among the country’s largest corporations. This year, independent research confirmed our observations.
The White & Case Public Company Advisory Group reviewed the annual meeting proxy statements and annual reports of 50 companies in the Fortune 100.15 In these 100 Securities and Exchange Commission (SEC) filings, White and Case focused on 12 categories16 of ESG disclosure in annual reports and proxy statements filed with the SEC in 2020, 2021 and 2022.
On March 21, the SEC proposed rule changes that would require corporations to include certain climate-related disclosures in their registration statements and periodic reports (See our Q2 2022 Corporate Bond Market Outlook as well as our ESG Newsletter article SEC Proposes Climate-Related Reporting Requirements). In its survey, White & Case found that climate-related disclosure significantly increased in both Form 10-K and proxy statement filings of the surveyed companies, with many companies including such disclosure for the first time in 2022.
White & Case found the ESG categories with the largest increases in disclosure were environmental matters, human capital management, environmental and social (E&S) targets and goals, corporate culture, board oversight of E&S issues, social impact/community, and E&S issues in shareholder engagement. The findings of the survey indicate to us a proactive approach among the largest corporate filers in considering and addressing key ESG matters, even in advance of SEC-promulgated rules on such disclosure.

[1] “Bonds in line for worst year in decades,” Reuters, June 30, 2022.
[2] Ibid.
[3] “Stocks markets post worst half in over five decades,” The Wall Street Journal, July 1, 2022.
[4] “US Investment Grade Corporate Update,” Barclays Credit Research, July 1, 2022.
[5] EPFR Global, June 30, 2022.
[6] “ESG Disclosure Trends in SEC Filings - Annual Survey 2022” White & Case, June 22, 2022.
[7] “Stocks rally to end the first day of the second half, Dow jumps 300 points,” CNBC, July 1, 2022.
[8] “Global Credit Conditions: Q2 2022 Confluence Of Risks Halts Positive Credit Momentum,” S&P Ratings, March 31, 2022.
[9] Citi Research, Bloomberg. Calculations made on matched sample of 300 U.S. IG non-financial, non-energy issuers, as of June 23, 2022.
[10] Bloomberg, June 30, 2022.
[11] S&P Ratings, July 1, 2022.
[12] Barclays Research, Bloomberg, Citi Research, as of July 1, 2022.
[13] EPFR Global, as of June 20, 3022.
[14] Barclays Live, Credit Suisse, Statista.
[15] Based on rankings from Fortune magazine's Fortune 500 list, the Fortune 100 are the 100 largest public and private companies in the United States based on revenues. The Fortune 100 are a subset of the Fortune 500, derived from a list of companies that operate in the United States and report to federal agencies.
[16] The 12 categories of E&S disclosure in this survey are the following: (1) Board Oversight of E&S Issues; (2) Corporate Culture;(3) Ethical Business Practices; (4) Human Capital Management; (5) Environmental Matters; (6) Social Impact and Community; (7)Political Contribution Disclosure; (8) Supply Chain Management; (9) E&S Qualifications of Directors; (10) E&S Issues in Shareholder Engagement; (11) E&S Goals; and (12) References to Sustainability Reporting Frameworks, including SASB and/or TCFD.
DISCLAIMER
This material provides general and/or educational information and should not be construed as a solicitation or offer of Breckinridge services or products or as legal, tax or investment advice. The content is current as of the time of writing or as designated within the material. All information, including the opinions and views of Breckinridge, is subject to change without notice.
Any estimates, targets, and projections are based on Breckinridge research, analysis, and assumptions. No assurances can be made that any such estimate, target or projection will be accurate; actual results may differ substantially.
Past performance is not a guarantee of future results. Breckinridge makes no assurances, warranties or representations that any strategies described herein will meet their investment objectives or incur any profits. Any index results shown are for illustrative purposes and do not represent the performance of any specific investment. Indices are unmanaged and investors cannot directly invest in them. They do not reflect any management, custody, transaction or other expenses, and generally assume reinvestment of dividends, income and capital gains. Performance of indices may be more or less volatile than any investment strategy.
Performance results for Breckinridge’s investment strategies include the reinvestment of interest and any other earnings, but do not reflect any brokerage or trading costs a client would have paid. Results may not reflect the impact that any material market or economic factors would have had on the accounts during the time period. Due to differences in client restrictions, objectives, cash flows, and other such factors, individual client account performance may differ substantially from the performance presented.
All investments involve risk, including loss of principal. Diversification cannot assure a profit or protect against loss. Fixed income investments have varying degrees of credit risk, interest rate risk, default risk, and prepayment and extension risk. In general, bond prices rise when interest rates fall and vice versa. This effect is usually more pronounced for longer-term securities. Income from municipal bonds can be declared taxable because of unfavorable changes in tax laws, adverse interpretations by the IRS or state tax authorities, or noncompliant conduct of a bond issuer.
Breckinridge believes that the assessment of ESG risks, including those associated with climate change, can improve overall risk analysis. When integrating ESG analysis with traditional financial analysis, Breckinridge’s investment team will consider ESG factors but may conclude that other attributes outweigh the ESG considerations when making investment decisions.
There is no guarantee that integrating ESG analysis will improve risk-adjusted returns, lower portfolio volatility over any specific time period, or outperform the broader market or other strategies that do not utilize ESG analysis when selecting investments. The consideration of ESG factors may limit investment opportunities available to a portfolio. In addition, ESG data often lacks standardization, consistency and transparency and for certain companies such data may not be available, complete or accurate.
Breckinridge’s ESG analysis is based on third party data and Breckinridge analysts’ internal analysis. Analysts will review a variety of sources such as corporate sustainability reports, data subscriptions, and research reports to obtain available metrics for internally developed ESG frameworks. Qualitative ESG information is obtained from corporate sustainability reports, engagement discussion with corporate management teams, among others. A high sustainability rating does not mean it will be included in a portfolio, nor does it mean that a bond will provide profits or avoid losses.
Net Zero alignment and classifications are defined by Breckinridge and are subjective in nature. Although our classification methodology is informed by the Net Zero Investment Framework Implementation Guide as outlined by the Institutional Investors Group on Climate Change, it may not align with the methodology or definition used by other companies or advisors. Breckinridge is a member of the Partnership for Carbon Accounting Financials and uses the financed emissions methodology to track, monitor and allocate emissions. These differences should be considered when comparing Net Zero application and strategies.
Targets and goals for Net Zero can change over time and could differ from individual client portfolios. Breckinridge will continue to invest in companies with exposure to fossil fuels; however, we may adjust our exposure to these types of investments based on net zero alignment and classifications over time.
Any specific securities mentioned are for illustrative and example only. They do not necessarily represent actual investments in any client portfolio.
The effectiveness of any tax management strategy is largely dependent on each client’s entire tax and investment profile, including investments made outside of Breckinridge’s advisory services. As such, there is a risk that the strategy used to reduce the tax liability of the client is not the most effective for every client. Breckinridge is not a tax advisor and does not provide personal tax advice. Investors should consult with their tax professionals regarding tax strategies and associated consequences.
Federal and local tax laws can change at any time. These changes can impact tax consequences for investors, who should consult with a tax professional before making any decisions.
The content may contain information taken from unaffiliated third-party sources. Breckinridge believes such information is reliable but does not guarantee its accuracy or completeness. Any third-party websites included in the content has been provided for reference only. Please see the Terms & Conditions page for third party licensing disclaimers.