Investing
Commentary published on November 9, 2022
October 2022 Market Commentary
Summary
- U.S. Treasury Curve: U.S. Treasury rates moved higher, most dramatically for short and long maturities, and the short end of the yield curve remained inverted (See Figure 1).
- Municipal Market Technicals: October issuance was almost $25 billion, 40 percent lower the same month in 2021, and 5.7 percent lower than the prior month. Mutual funds saw outflows of more than $13 billion.
- Corporate Market Technicals: Investment grade (IG) fixed-rate bond issuance for October was $104 billion. IG bond funds reported nearly $17 billion of outflows during the month.
- Securitized Trends: Mortgage-Backed Securities (MBS) underperformed Treasuries on an excess return basis for the third consecutive month. The asset-backed securities (ABS) index also trailed Treasuries.
(The following commentary is a summary of discussions among members of the Breckinridge Capital Advisors Investment Committee as they reviewed monthly activity in the markets and investment returns. The members of the Investment Committee under the leadership of Chief Investment Officer Ognjen Sosa, CAIA, FRM, are Co-Head of Portfolio Management, Matthew Buscone; Senior Portfolio Manager Sara Chanda; Co-Head of Research, Nicholas Elfner; Co-Head of Portfolio Management, Jeffrey Glenn, CFA; Head of Municipal Trading, Benjamin Pease; and Co-Head of Research, Adam Stern, JD.)
Market Review
With the Federal Reserve (Fed) not meeting in October, investors were on their own to consider the future direction of rates. The results were a Treasury curve inversion extending down to 3-month maturities, a steepening curve in intermediate and long maturities, and continued high volatility (See Figure 1).

While relatively small compared to September’s jump of more than 70 basis points (bps), yields on the 2- and 5- year maturities increased by 20 and 14bps, respectively, while the 10- and 30-year spots gained 22 and 39bps, respectively.
The yield curve flattened by 7bps between the 2-year and 5-year maturities, while the curve steepened by 1bp between the 2-year and 10-year maturities, and by 18bps between the 10- and 30-year maturities.
The ICE/Bank of America Merrill Lynch MOVE Index,[1] a measure of bond market volatility, sustained high levels reached during late September (See Figure 2). At the end of October, the 3-month Treasury bill yielded 4.07 percent, 2bps more than the 10-year Treasury bond. Historically, this type of curve inversion has been a reliable indicator of recessions and shifts in Fed rate policy. Some investors thought that the Fed might reduce the level (75bps) at which it increased the federal funds rate at each of its last three meetings.

But that didn’t deter the Fed. With inflation running well above its target and unemployment still historically low, the Fed felt comfortable hiking more aggressively.
Fed officials met during the first week of November, increasing the federal funds rate by 75bps for the fourth time in 2022. Some investors took refuge that future hikes might moderate in this comment from the FOMC that accompanies the announcements, “The committee will take into account the cumulative tightening of monetary policy, the lags with which monetary policy affects economic activity and inflation, and economic and financial developments.”
Fed governors continued to see reports that suggested the economy was running at a high rate. The economy expanded at an annualized rate of 2.6 percent in the third quarter, per Bureau of Economic Analysis data. Inflation indicators, which retrenched a little in August, reversed course in September. The personal consumption expenditures price index and the consumer price index increased. A strong labor market and ample savings supported consumer spending, with personal spending increasing 1.4 percent in the third quarter. Industrial production increased, as did new orders for durable goods. Crude oil prices were higher after large output cuts by the group of OPEC+ nations. Housing sector readings lagged, suggesting the Fed’s rate increases were helping to cool that hot market.
During October, the Bloomberg (BBG) U.S. Treasury Bond Index declined 1.4 percent. The BBG U.S. Aggregate Bond Index dropped 1.3 percent. The equity benchmark S&P 500 Index gained 8 percent.
Municipal Market Review
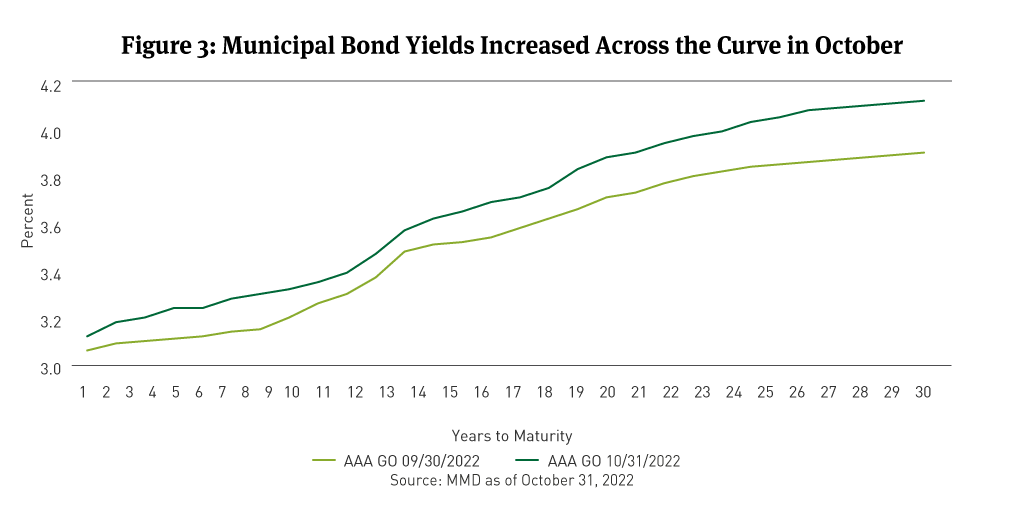
Municipal bonds outperformed Treasuries, as yields rose across the curve during the month (See Figure 3). Yields were 9bps higher in 2-and 10-years, while the- 30-year spot closed the month 22bps higher.
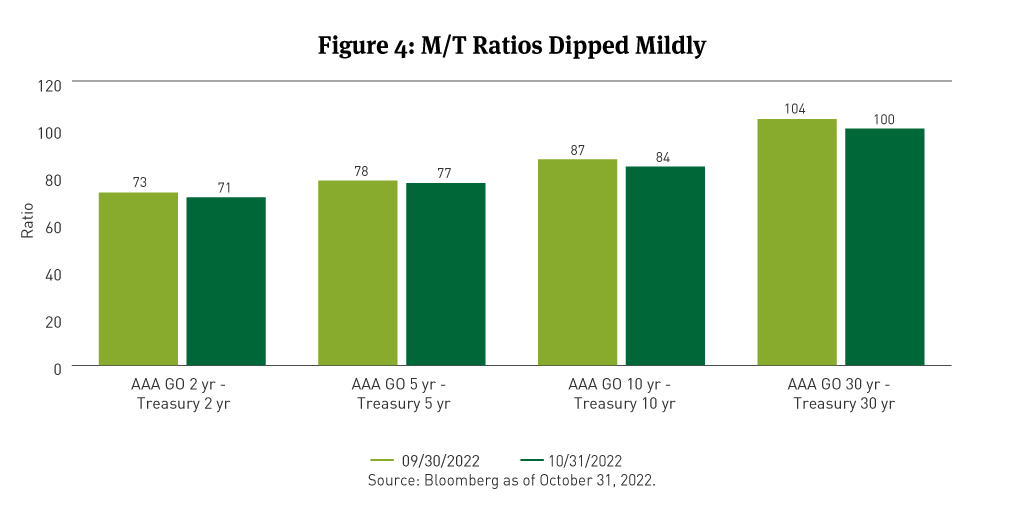
The municipal curve steepened a bit over the month, with the 2s/10s and 2s/30s closing unchanged and 13bps wider. Municipal/Treasury (M/T) ratios dipped mildly across the curve and continue to exhibit volatility (See Figure 4).
The Bond Buyer reported that municipal bond issuance in October was down 5.8 percent month-over-month and 40 percent year-over-year (Y/Y). Taxable municipal bond issuance continued to trail the prior year’s total, down 50 percent Y/Y. Tax-exempt issuance was down 7 percent from 2021. Lipper data showed municipal bond mutual fund outflows of $13 billion in October to reach $105 billion year-to-date.
The BBG Managed Money Short/Intermediate (1-10) Index declined 0.23 percent and the BBG 1-10 Year Blend Index was down 0.26 percent. Shorter-maturity bonds outperformed longer-maturity issues. Higher-rated bonds tended to outperform lower-rated bonds.
Corporate Market Review
IG corporate bond spreads were unchanged, per BBG data, ending October at 158bps. The BBG U.S. Corporate Investment Grade (IG) Index fell 1.03 percent on a total return basis, with a positive excess return of 0.36 percent compared with duration-matched Treasuries.
With corporate earnings reports well underway by the end of October, FactSet reported that S&P 500 companies blended earnings growth rate for the third quarter was 2.2 percent, following 6.2 percent in the second quarter. At the sector level, four sectors—Energy, Real Estate, Industrials, and Consumer Discretionary—are reporting Y/Y growth in earnings for the quarter. The Energy sector reported the highest earnings growth of these four sectors at 134 percent.
Per BBG, the best-performing sectors for the month of October were Oil Field Services, Cable/Satellite, Food & Beverage, Independent Energy, and Oil Refining, per BBG. The worst-performing were Real Estate Investment Trusts (REITs), Foreign Local Government, Supermarkets, Packaging, and Supranationals. Bonds rated A were the worst performers, while bonds rated AAA were the best.
October index-eligible IG bond issuance of $104.2 billion, per BBG, left net issuance at $50 billion after about $54 billion in redemptions, up substantially compared with the prior month. Corporate bond mutual funds saw $17 billion in outflows, per Emerging Portfolio Fund Research.
Securitized Market Review
Elevated rate volatility continued to repress the securitized markets. The BBG MBS Index experienced a negative 1.4 percent total return and negative 29bps in excess return. Continuing with the theme all year, lower coupons underperformed higher coupons across the sector, and Government National Mortgage Association MBS outperformed conventionals[2] across the coupon stack.
BBG data showed spreads widened the least during the month for Agency Commercial MBS (ACMBS), which outperformed non-agency CMBS, where spreads widened the most.
ABS sector performance was negative 84bps, per BBG, on a total return basis, and negative 72bps for excess returns. Auto loans outperformed credit cards on a total return basis (-0.84 percent versus -0.90 percent, respectively) and underperformed on an excess return measure (-0.78 percent versus -0.70 percent, respectively).
[1] The MOVE Index measures U.S. interest rate volatility by tracking the movement in U.S. Treasury yield volatility implied by current prices of one-month over-the-counter options on 2-year, 5-year, 10-year and 30-year Treasuries. Historically, the index rises as concerns grow that interest rates are moving higher.
[2] Conventional MBS are issued by the Federal National Mortgage Association and the Federal Home Loan Mortgage Corporation.
#312363 (11/8/2022)
DISCLAIMER:
This material provides general and/or educational information and should not be construed as a solicitation or offer of Breckinridge services or products or as legal, tax or investment advice. The content is current as of the time of writing or as designated within the material. All information, including the opinions and views of Breckinridge, is subject to change without notice.
Any estimates, targets, and projections are based on Breckinridge research, analysis, and assumptions. No assurances can be made that any such estimate, target or projection will be accurate; actual results may differ substantially.
Past performance is not a guarantee of future results. Breckinridge makes no assurances, warranties or representations that any strategies described herein will meet their investment objectives or incur any profits. Any index results shown are for illustrative purposes and do not represent the performance of any specific investment. Indices are unmanaged and investors cannot directly invest in them. They do not reflect any management, custody, transaction or other expenses, and generally assume reinvestment of dividends, income and capital gains. Performance of indices may be more or less volatile than any investment strategy.
Performance results for Breckinridge’s investment strategies include the reinvestment of interest and any other earnings, but do not reflect any brokerage or trading costs a client would have paid. Results may not reflect the impact that any material market or economic factors would have had on the accounts during the time period. Due to differences in client restrictions, objectives, cash flows, and other such factors, individual client account performance may differ substantially from the performance presented.
All investments involve risk, including loss of principal. Diversification cannot assure a profit or protect against loss. Fixed income investments have varying degrees of credit risk, interest rate risk, default risk, and prepayment and extension risk. In general, bond prices rise when interest rates fall and vice versa. This effect is usually more pronounced for longer-term securities.
Income from municipal bonds can be declared taxable because of unfavorable changes in tax laws, adverse interpretations by the IRS or state tax authorities, or noncompliant conduct of a bond issuer.
Breckinridge believes that the assessment of ESG risks, including those associated with climate change, can improve overall risk analysis. When integrating ESG analysis with traditional financial analysis, Breckinridge’s investment team will consider ESG factors but may conclude that other attributes outweigh the ESG considerations when making investment decisions.
There is no guarantee that integrating ESG analysis will improve risk-adjusted returns, lower portfolio volatility over any specific time period, or outperform the broader market or other strategies that do not utilize ESG analysis when selecting investments. The consideration of ESG factors may limit investment opportunities available to a portfolio. In addition, ESG data often lacks standardization, consistency and transparency and for certain companies such data may not be available, complete or accurate.
Breckinridge’s ESG analysis is based on third party data and Breckinridge analysts’ internal analysis. Analysts will review a variety of sources such as corporate sustainability reports, data subscriptions, and research reports to obtain available metrics for internally developed ESG frameworks. Qualitative ESG information is obtained from corporate sustainability reports, engagement discussion with corporate management teams, among others. A high sustainability rating does not mean it will be included in a portfolio, nor does it mean that a bond will provide profits or avoid losses.
Net Zero alignment and classifications are defined by Breckinridge and are subjective in nature. Although our classification methodology is informed by the Net Zero Investment Framework Implementation Guide as outlined by the Institutional Investors Group on Climate Change, it may not align with the methodology or definition used by other companies or advisors. Breckinridge is a member of the Partnership for Carbon Accounting Financials and uses the financed emissions methodology to track, monitor and allocate emissions. These differences should be considered when comparing Net Zero application and strategies.
Targets and goals for Net Zero can change over time and could differ from individual client portfolios. Breckinridge will continue to invest in companies with exposure to fossil fuels; however, we may adjust our exposure to these types of investments based on net zero alignment and classifications over time.
Any specific securities mentioned are for illustrative and example only. They do not necessarily represent actual investments in any client portfolio.
The effectiveness of any tax management strategy is largely dependent on each client’s entire tax and investment profile, including investments made outside of Breckinridge’s advisory services. As such, there is a risk that the strategy used to reduce the tax liability of the client is not the most effective for every client.
Breckinridge is not a tax advisor and does not provide personal tax advice. Investors should consult with their tax professionals regarding tax strategies and associated consequences.
Federal and local tax laws can change at any time. These changes can impact tax consequences for investors, who should consult with a tax professional before making any decisions.
The content may contain information taken from unaffiliated third-party sources. Breckinridge believes such information is reliable but does not guarantee its accuracy or completeness. Any third-party websites included in the content has been provided for reference only. Please see the Terms & Conditions page for third party licensing disclaimers.