Investing
Commentary published on December 8, 2022
November 2022 Market Commentary
Summary
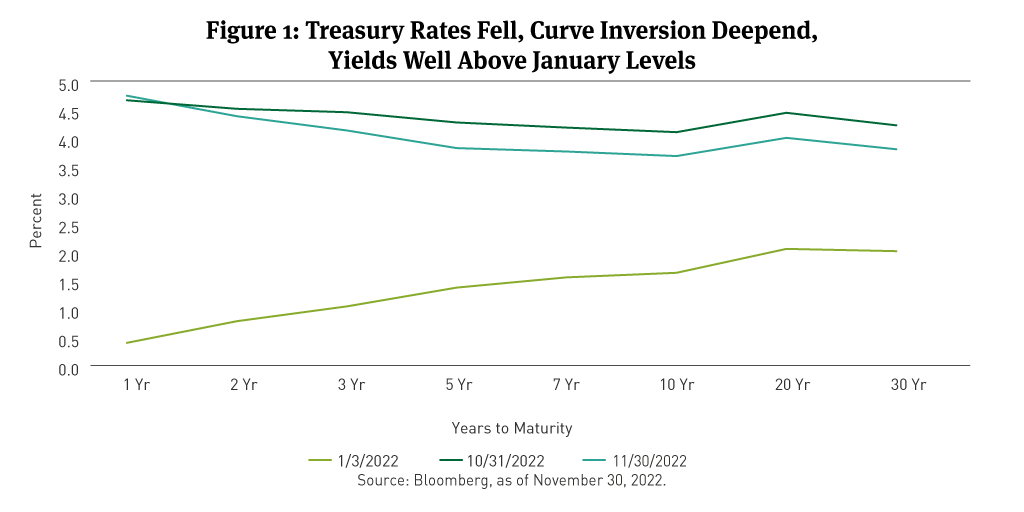
- U.S. Treasury Curve: U.S. Treasury rates fell beyond one year, while yields remained well above January levels (See Figure 1).
- Municipal Market Technicals: November issuance was less than $20 billion, the lowest month of the year. Low supply was a predominant influence on municipal bond performance.
- Corporate Market Technicals: Investment grade (IG) fixed-rate bond issuance for November was $112 billion. IG bond funds reported about $2.5 billion of outflows during the month.
- Securitized Trends: Mortgage-backed securities (MBS) and asset-backed securities (ABS) each delivered positive total monthly returns, based on Bloomberg index returns.
(The following commentary is a summary of discussions among members of the Breckinridge Capital Advisors Investment Committee as they reviewed monthly activity in the markets and investment returns. The members of the Investment Committee under the leadership of Chief Investment Officer Ognjen Sosa, CAIA, FRM, are Co-Head of Portfolio Management, Matthew Buscone; Senior Portfolio Manager Sara Chanda; Co-Head of Research, Nicholas Elfner; Co-Head of Portfolio Management, Jeffrey Glenn, CFA; Head of Municipal Trading, Benjamin Pease; and Co-Head of Research, Adam Stern, JD.)
Market Review
As data began to show signs of moderating inflation and slowing economic growth, expectations increased that the Federal Reserve (Fed) might reduce the size and pace of fed fund rate hikes. Improved sentiment encouraged investors to reconsider risk assets, bolstering values across bond and equity markets. Interest rate volatility remained elevated as measured by the ICE/Bank of America Merrill Lynch MOVE Index,1 (See Figure 2).

October Consumer Price Index (CPI) data released mid-month was below expectations, with year-over-year headline inflation’s increase the smallest reading this year. During the month, there were also signs of a slowing housing market (existing sales and new starts), labor and wage growth normalization, and moderating supply chain pressures. Markets welcomed a lower Personal Consumption Expenditures (PCE) reading later in the month.
Yields for Treasuries of 1-year maturity or less increased, with the 1-year yield up by the least amount at 8 basis points (bps). Yields for Treasuries maturing from 3 and 30 years fell between 40 and 50 basis points (bps).
The curve’s inversion deepened, as short-term yields increased, and longer maturities faced falling yields. The slope of curve continued to invert, with the 3-month yield 58bps higher than the 10-year Treasury bond.
Historically, Treasury curve inversions are forerunners of recessions. As the month closed, the mix of well-received economic data and a potential downshift in Fed interest rate increases are causing disparity among observers on the likelihood, timing, and severity of a recession.
After the Fed’s early-November 75bps increase to the fed funds rate, some investors hoped future hikes might moderate In comments offered at the end of the month, Fed Chairman Jerome Powell suggested that future scenario was likely, but the timing of that moderation was less definitive.
“While October inflation data received so far showed a welcome surprise to the downside, these are a single month's data, which followed upside surprises over the previous two months,” he said. “The time for moderating the pace of rate increases may come as soon as the December meeting.”
During November, the Bloomberg (BBG) U.S. Treasury Bond Index2 was up 2.7percent. The BBG U.S. Aggregate Bond Index3 gained 3.7 percent. The S&P 500 Index4 added 5.4 percent.
Municipal Market Review
Municipal bond yields fell 60bps or more from 2 to 30 years (See Figure 3), outperforming Treasuries across the curve. The 2s/10s curve closed 3bps flatter. The 2s/30s curve was 5bps steeper. Municipal/Treasury (M/T) ratios declined (See Figure 4).


The Bond Buyer reported that municipal bond issuance in November was $19.7 billion, down 29 percent month-over-month and 47 percent year-over-year (Y/Y). Monthly issuance has not dipped that low since 1999, The Bond Buyer reported. Year-to-date, tax-exempt municipal bond issuance is 9 percent lower and taxable municipal bond issuance is off 53 percent compared to 2021. Lipper data showed municipal bond mutual fund outflows of $4 billion in November, as some observers looked for signs of a reversal of the year-long outflow trend.
The BBG Managed Money Short/Intermediate (1-10) Index5 gained 3.3 percent—the second-highest monthly return in its history—and the BBG 1-10 Year Municipal Bond Blended Index6 added 2.9 percent. Shorter-maturity bonds underperformed longer-maturity issues. Lower-rated bonds outperformed.
Corporate Market Review
IG corporate bond spreads were 25bps tighter, per BBG data, ending November at 135bps. The BBG U.S. Corporate Investment Grade (IG) Index7 gained 5.2 percent on a total return basis, with a positive excess return of 2.1 percent compared with duration-matched Treasuries.
Corporate third quarter earnings report season near a close in November, with 94 percent of companies included in the S&P 500 Index announcing results, per FactSet. Of those companies, 70 percent beat earnings per share estimates, down from the 5-year average of 77 percent. Their average 2.4 percent earnings growth rate reported by those companies was the lowest since 3Q 2020.
FactSet reported that fewer S&P 500 companies discussed the term recession during their earnings conference calls for the third quarter compared to the second quarter. Based on its review of conference call transcripts, of all the S&P 500 companies that conducted earnings conference calls from September 15 through November 16, 179 cited the term recession during their earnings calls for the third quarter, compared with 242 that cited the term during second quarter earnings calls (June 15 through September 14).
Per BBG, the best-performing sectors for the month of November were Sovereigns, Cable Satellite, Wirelines and Railroads. The worst-performing were Supranationals, Airlines, Construction Machinery, and Lodging. Bonds rated BBB were the best performers on an excess return basis. AAA-rated bonds were the best performers on a total return basis. The performance of bonds rated A trailed the other IG credit categories on a total return basis but were second only to BBB-rated bonds in excess return.
November index-eligible IG bond issuance was $112 billion, per BBG, about $8 billion more than the prior month and $2 billion less than the same month a year ago. Net issuance was $39 billion after about $73 billion in redemptions. Corporate bond mutual funds saw $2.5 billion in outflows, per Emerging Portfolio Fund Research.
Securitized Market Review
The BBG MBS Index8 experienced a positive 3.4 percent total return and 1.4 percent excess return, in a notable reversal of prior months’ retrenchments in the sector. The strength was broad based across the coupon stack with lower coupons generally doing better and 30-year conventional9 MBS outperformed Ginnie Mae and 15-year securities.
BBG data showed Agency Commercial MBS (ACMBS) outperforming non-agency CMBS on a total and excess return basis.
ABS sector total return performance was positive 73bps, per BBG, and negative by 3bps on an excess return basis. Credit card ABS outperformed auto loans on the basis of total and excess returns.
[1] The MOVE Index measures U.S. interest rate volatility by tracking the movement in U.S. Treasury yield volatility implied by current prices of one-month over-the-counter options on 2-year, 5-year, 10-year and 30-year Treasuries. Historically, the index rises as concerns grow that interest rates are moving higher.
[2] The Bloomberg U.S. Treasury Bond Index is an unmanaged index of prices of U.S. Treasury bonds with maturities of 1 to 30 years. You cannot invest directly in an index. You cannot invest directly in an index.
[3] The Bloomberg U.S. Aggregate Bond Index is a broad-based benchmark that measures the investment-grade, U.S.-dollar-denominated, fixed-rate taxable bond market, including Treasuries, government-related and corporate securities, mortgage-backed securities (agency fixed-rate and hybrid adjustable-rate mortgage pass-throughs), asset-backed securities, and commercial mortgage-backed securities. You cannot invest directly in an index.
[4] The S&P 500 Index consists of 500 stocks chosen for market size, liquidity, and industry group representation. Itis a market-value-weighted index with each stock’s weight in the index proportionate to its market value. You cannot invest directly in an index.
[5] The Bloomberg Municipal Managed Money Short/Intermediate Index measures the performance of the publicly traded municipal bonds that cover the USD-denominated short/intermediate term tax-exempt bond market, including state and local general obligation bonds, revenue bonds, insured bonds, and pre-refunded bonds. It is rules-based and market-value weighted. You cannot invest directly in an index.
[6] The Bloomberg Municipal 1-10 Year Blend 1-12 Year Index measures the performance of short and intermediate components of the Municipal Bond Index — an unmanaged, market value-weighted index which covers the U.S. investment grade, tax-exempt bond market. You cannot invest directly in an index.
[7] The Bloomberg U.S. Corporate Bond Index is an unmanaged market-value-weighted index of investment-grade corporate fixed-rate debt issues with maturities of one year or more. You cannot invest directly in an index.
[8] The Bloomberg MBS Index tracks agency mortgage backed pass-through securities (both fixed-rate and hybrid ARM) guaranteed by Ginnie Mae (GNMA), Fannie Mae (FNMA), and Freddie Mac (FHLMC). The index is constructed by grouping individual pools into aggregates or generics based on program, coupon, and vintage. You cannot invest directly in an index.
[9] Conventional MBS are issued by the Federal National Mortgage Association and the Federal Home Loan Mortgage Corporation.
#316493 (12/8/2022)
DISCLAIMER:
This material provides general and/or educational information and should not be construed as a solicitation or offer of Breckinridge services or products or as legal, tax or investment advice. The content is current as of the time of writing or as designated within the material. All information, including the opinions and views of Breckinridge, is subject to change without notice.
There is no assurance that any estimate, target, projection or forward-looking statement (collectively, “estimates”) included in this material will be accurate or prove to be profitable; actual results may differ substantially. Breckinridge estimates are based on Breckinridge’s research, analysis and assumptions. Other events that were not considered in formulating such projections could occur and may significantly affect the outcome, returns or performance.
Not all securities or issuers mentioned represent holdings in client portfolios. Some securities have been provided for illustrative purposes only and should not be construed as investment recommendations. Any illustrative engagement or ESG analysis examples are intended to demonstrate Breckinridge’s research and investment process.
Past performance is not a guarantee of future results. Breckinridge makes no assurances, warranties or representations that any strategies described herein will meet their investment objectives or incur any profits. Any index results shown are for illustrative purposes and do not represent the performance of any specific investment. Indices are unmanaged and investors cannot directly invest in them. They do not reflect any management, custody, transaction or other expenses, and generally assume reinvestment of dividends, income and capital gains. Performance of indices may be more or less volatile than any investment strategy.
Performance results for Breckinridge’s investment strategies include the reinvestment of interest and any other earnings, but do not reflect any brokerage or trading costs a client would have paid. Results may not reflect the impact that any material market or economic factors would have had on the accounts during the time period. Due to differences in client restrictions, objectives, cash flows, and other such factors, individual client account performance may differ substantially from the performance presented.
All investments involve risk, including loss of principal. Diversification cannot assure a profit or protect against loss. Fixed income investments have varying degrees of credit risk, interest rate risk, default risk, and prepayment and extension risk. In general, bond prices rise when interest rates fall and vice versa. This effect is usually more pronounced for longer-term securities. Income from municipal bonds can be declared taxable because of unfavorable changes in tax laws, adverse interpretations by the IRS or state tax authorities, or noncompliant conduct of a bond issuer.
Breckinridge believes that the assessment of ESG risks, including those associated with climate change, can improve overall risk analysis. When integrating ESG analysis with traditional financial analysis, Breckinridge’s investment team will consider ESG factors but may conclude that other attributes outweigh the ESG considerations when making investment decisions.
There is no guarantee that integrating ESG analysis will improve risk-adjusted returns, lower portfolio volatility over any specific time period, or outperform the broader market or other strategies that do not utilize ESG analysis when selecting investments. The consideration of ESG factors may limit investment opportunities available to a portfolio. In addition, ESG data often lacks standardization, consistency and transparency and for certain companies such data may not be available, complete or accurate.
Breckinridge’s ESG analysis is based on third party data and Breckinridge analysts’ internal analysis. Analysts will review a variety of sources such as corporate sustainability reports, data subscriptions, and research reports to obtain available metrics for internally developed ESG frameworks. Qualitative ESG information is obtained from corporate sustainability reports, engagement discussion with corporate management teams, among others. A high sustainability rating does not mean it will be included in a portfolio, nor does it mean that a bond will provide profits or avoid losses.
The effectiveness of any tax management strategy is largely dependent on each investor’s entire tax and investment profile, including investments made outside of Breckinridge’s advisory services. As such, there is a risk that the strategy used to reduce the tax liability of the investor is not the most effective for that investor. Breckinridge is not a tax advisor and does not provide personal tax advice. Investors should consult with their tax professionals regarding tax strategies and associated consequences.
Federal and local tax laws can change at any time. These changes can impact tax consequences for investors, who should consult with a tax professional before making any decisions.
Separate accounts may not be suitable for all investors.
Some information has been taken directly from unaffiliated third-party sources. Breckinridge believes such information is reliable but does not guarantee its accuracy or completeness. Any third-party websites included in the content has been provided for reference only.
Certain third parties require us to include the following language when using their information:
BLOOMBERG® is a trademark and service mark of Bloomberg Finance L.P. and its affiliates (collectively “Bloomberg”). Bloomberg does not approve or endorse this material or guarantees the accuracy or completeness of any information herein, or makes any warranty, express or implied, as to the results to be obtained therefrom and, to the maximum extent allowed by law, neither shall have any liability or responsibility for injury or damages arising in connection therewith.