Investing
Commentary published on February 7, 2022
January 2022 Market Commentary
Summary
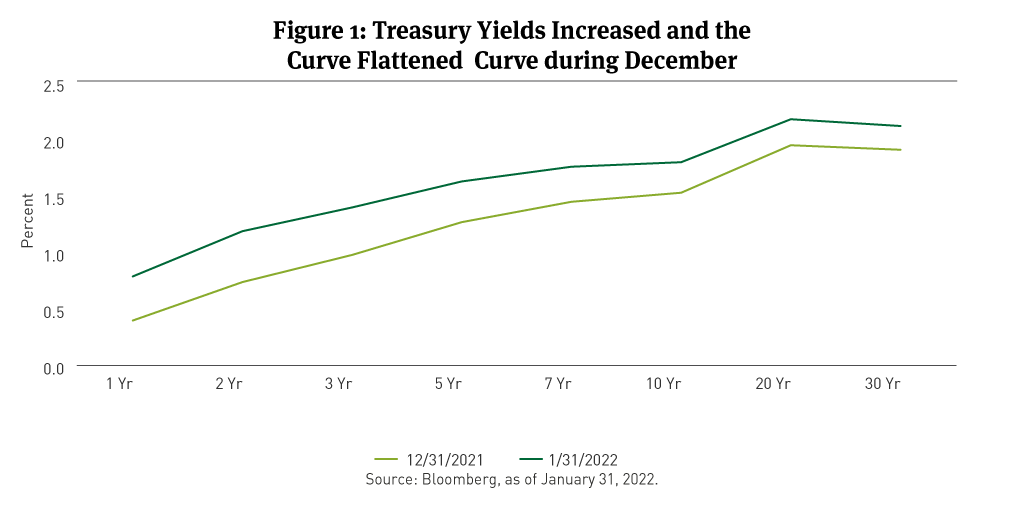
- U.S. Treasury Curve: U.S. Treasury rates increased, and the curve flattened. (See Figure 1)
- Municipal Market Technicals: January issuance was $24 billion, 37 percent lower than December. Monthly mutual fund outflows were about $1 billion in January.
- Corporate Market Technicals: Investment grade (IG) fixed-rate bond supply for January was $181 billion. IG bond funds reported $8 billion of outflows during the month.
- Securitized Trends: Excess returns for asset-backed securities (ABS) were mixed. Agency commercial mortgage-backed securities (ACMBS) were slightly positive, while residential and commercial mortgage-backed securities (MBS and CMBS, respectively) were negative.
(The following commentary is a summary of discussions among members of the Breckinridge Capital Advisors Investment Committee as they reviewed monthly activity in the markets and investment returns. The members of the Investment Committee under the leadership of Chief Investment Officer Ognjen Sosa, CAIA, FRM, are Co-Head, Portfolio Management, Matthew Buscone; Senior Portfolio Manager Sara Chanda; Co-Head, Research, Nicholas Elfner; Co-Head, Portfolio Management, Jeffrey Glenn, CFA; Head, Municipal Trading, Benjamin Pease; and Co-Head, Research, Adam Stern, JD.)
Market Review
A volatile January for investments, highlighted by a Federal Reserve (Fed) sounding more intent on raising interest rates, ended on a positive note, as bond and stock prices regained a measure of the losses realized earlier in the month.
Inflation continued to run well above trend with the Personal Consumption Expenditures (PCE) core deflator coming in at 4.9 percent, year-over-year. Treasury yields increased and market expectations for the number of fed funds rate increases in 2022 increased to 5 by year-end.
Through its statements before and after its January meeting, the Federal Open Market Committee appeared ready to start raising the federal funds rate from its zero-lower bound in March. At some point thereafter, the Fed will begin to reduce the size of its balance sheet, which has grown to $9 trillion in an effort to spark economic activity during the pandemic-induced economic restrictions.
The Treasury curve bear flattened (short term rates rise faster than long term rates) with 2-, 5-, 10-, and 30-year yields rising by 45, 35, 27, and 21 basis points (bps), respectively. The spread between the 2- and 5-year spots on the Treasury curve narrowed by 18bps, while the 2s/30s curve tightened by 24bps.
Municipal Market Review
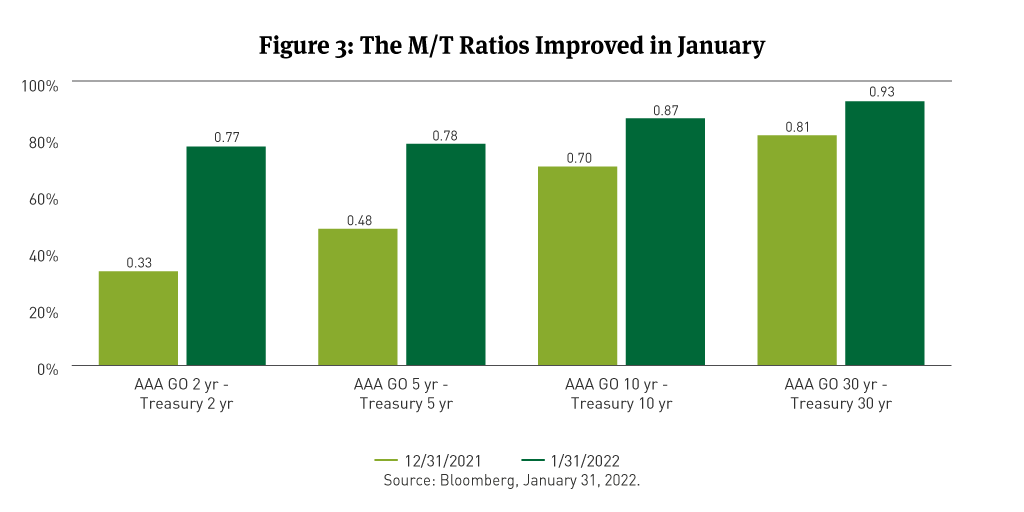
Municipal bond yield increased, underperforming Treasuries during January (See Figure 2) and Municipal/Treasury ratios improved across the curve (See Figure 3). Municipal bond issuance slowed during the month.

The municipal yield curve finally responded to the flattening that had occurred in the Treasury curve. The 2- to 10-year slope has now fallen from just over 100bps at the end of October 2021 to 66bps at the end of January 2022.
Municipal yields at 2-, 5-, 10-, and 30-years rose by 66, 63, 52, and 46bps, respectively. The spread for the municipal 2s/10s curve narrowed by 14bps, while the 2s/30s municipal curve tightened by 20bps.
The underperformance of municipals drove ratios sharply higher during the month, rising to 77 percent for the two-year maturity, 87 percent for the 10-year, and 93 percent for the 30-year, flattening the ratio curve. Ratios at these more attractive levels allowed us opportunities to add bonds at more compelling yields from both an absolute and relative-value standpoint.
January issuance at $24 billion was 37 percent lower than the prior month and 15 percent lower than January 2021, per The Bond Buyer. At almost $19 billion, tax-exempt issuance was just 1.8 percent off last year’s January total, whereas taxable issuance dropped 54 percent from January 2021, as increasing interest rates made refinancing with taxable bonds less attractive.
Municipal bond fund flows were negative, the first monthly outflow since April 2020. Investment Company Institute data show that as of January 26, 2022, fund outflows had totaled about $1 billion during the month.
For January, the Bloomberg Managed Money Short/Intermediate (1-10) Index fell 2.63 percent while the Bloomberg 1-10 Year Blend Index declined 2.22 percent. Shorter-maturity bonds outperformed bonds at the long end of the curve. Municipal bonds with higher relative credit ratings outperformed bonds of lower quality.
Corporate Market Review
IG corporate bond spreads widened by 13bps in January, per Bloomberg data, to settle at 106bps. The Bloomberg U.S. Corporate Investment Grade (IG) Index fell 3.37 percent for January on a total return basis and 1.15 percent on an excess return basis compared with duration-matched Treasuries.
Bloomberg data showed that dispersion in performance among bonds based on credit-quality rating was limited with higher-quality issues slightly outperforming the lowest IG-quality bonds. IG corporate bonds with shorter maturities turned in the best performance on a total return basis.
The best-performing sectors were Automobiles, Commercial & Consumer Finance, Real Estate Investment Trusts, and Life Insurance. Underperforming sectors included Media & Entertainment, Technology, and Railroads.
Index-eligible IG bond issuance in January, per Bloomberg, was nearly $181 billion, a decrease from about $62 billion in December. Net issuance, after redemptions, was $90 billion, following a negative net total in December. According to EPFR, IG bond funds reported $8 billion of outflows in January.
Securitized Market Review
In securitized sectors in January, spreads widened across current coupon MBS, per Bloomberg data. The broad Bloomberg MBS Index had a negative excess return of 12bps. Within MBS, higher coupon securities outperformed lower coupons. Among ACMBS, spreads tightened, delivering a 1bp excess return. CMBS had a negative excess return of 2bps, per Bloomberg data
In the ABS market segment, spreads narrowed 6bps and 8bps for auto loan and credit card debt, respectively. Credit card-backed securities earned an excess return of 23bps, while securities backed by auto loans added 18bps in excess return for the month.
#283389 (2/8/2022)
DISCLAIMER
This material provides general and/or educational information and should not be construed as a solicitation or offer of Breckinridge services or products or as legal, tax or investment advice. The content is current as of the time of writing or as designated within the material. All information, including the opinions and views of Breckinridge, is subject to change without notice.
Any estimates, targets, and projections are based on Breckinridge research, analysis, and assumptions. No assurances can be made that any such estimate, target or projection will be accurate; actual results may differ substantially.
Past performance is not a guarantee of future results. Breckinridge makes no assurances, warranties or representations that any strategies described herein will meet their investment objectives or incur any profits. Any index results shown are for illustrative purposes and do not represent the performance of any specific investment. Indices are unmanaged and investors cannot directly invest in them. They do not reflect any management, custody, transaction or other expenses, and generally assume reinvestment of dividends, income and capital gains. Performance of indices may be more or less volatile than any investment strategy.
Performance results for Breckinridge’s investment strategies include the reinvestment of interest and any other earnings, but do not reflect any brokerage or trading costs a client would have paid. Results may not reflect the impact that any material market or economic factors would have had on the accounts during the time period. Due to differences in client restrictions, objectives, cash flows, and other such factors, individual client account performance may differ substantially from the performance presented.
All investments involve risk, including loss of principal. Diversification cannot assure a profit or protect against loss. Fixed income investments have varying degrees of credit risk, interest rate risk, default risk, and prepayment and extension risk. In general, bond prices rise when interest rates fall and vice versa. This effect is usually more pronounced for longer-term securities. Income from municipal bonds can be declared taxable because of unfavorable changes in tax laws, adverse interpretations by the IRS or state tax authorities, or noncompliant conduct of a bond issuer.
Breckinridge believes that the assessment of ESG risks, including those associated with climate change, can improve overall risk analysis. When integrating ESG analysis with traditional financial analysis, Breckinridge’s investment team will consider ESG factors but may conclude that other attributes outweigh the ESG considerations when making investment decisions.
There is no guarantee that integrating ESG analysis will improve risk-adjusted returns, lower portfolio volatility over any specific time period, or outperform the broader market or other strategies that do not utilize ESG analysis when selecting investments. The consideration of ESG factors may limit investment opportunities available to a portfolio. In addition, ESG data often lacks standardization, consistency and transparency and for certain companies such data may not be available, complete or accurate.
Breckinridge’s ESG analysis is based on third party data and Breckinridge analysts’ internal analysis. Analysts will review a variety of sources such as corporate sustainability reports, data subscriptions, and research reports to obtain available metrics for internally developed ESG frameworks. Qualitative ESG information is obtained from corporate sustainability reports, engagement discussion with corporate management teams, among others. A high sustainability rating does not mean it will be included in a portfolio, nor does it mean that a bond will provide profits or avoid losses.
Net Zero alignment and classifications are defined by Breckinridge and are subjective in nature. Although our classification methodology is informed by the Net Zero Investment Framework Implementation Guide as outlined by the Institutional Investors Group on Climate Change, it may not align with the methodology or definition used by other companies or advisors. Breckinridge is a member of the Partnership for Carbon Accounting Financials and uses the financed emissions methodology to track, monitor and allocate emissions. These differences should be considered when comparing Net Zero application and strategies.
Targets and goals for Net Zero can change over time and could differ from individual client portfolios. Breckinridge will continue to invest in companies with exposure to fossil fuels; however, we may adjust our exposure to these types of investments based on net zero alignment and classifications over time.
Any specific securities mentioned are for illustrative and example only. They do not necessarily represent actual investments in any client portfolio.
The effectiveness of any tax management strategy is largely dependent on each client’s entire tax and investment profile, including investments made outside of Breckinridge’s advisory services. As such, there is a risk that the strategy used to reduce the tax liability of the client is not the most effective for every client. Breckinridge is not a tax advisor and does not provide personal tax advice. Investors should consult with their tax professionals regarding tax strategies and associated consequences.
Federal and local tax laws can change at any time. These changes can impact tax consequences for investors, who should consult with a tax professional before making any decisions.
The content may contain information taken from unaffiliated third-party sources. Breckinridge believes such information is reliable but does not guarantee its accuracy or completeness. Any third-party websites included in the content has been provided for reference only. Please see the Terms & Conditions page for third party licensing disclaimers.