Investing
Commentary published on March 9, 2022
February 2022 Market Commentary
Summary
- U.S. Treasury Curve: U.S. Treasury rates increased, and the curve flattened. (See Figure 1)
- Municipal Market Technicals: February issuance was $26 billion, 5 percent higher than January. Monthly mutual fund outflows were more than $7 billion in February.
- Corporate Market Technicals: Investment grade (IG) fixed-rate bond supply for February was $85 billion. IG bond funds reported about $1 billion of inflows during the month.
- Securitized Trends: Excess returns for securitized bonds were negative across most sectors and subsectors. Agency commercial mortgage-backed securities (ACMBS), and credit card and auto loan asset-backed securities (ABS) were among the better performers.
(The following commentary is a summary of discussions among members of the Breckinridge Capital Advisors Investment Committee as they reviewed monthly activity in the markets and investment returns. The members of the Investment Committee under the leadership of Chief Investment Officer Ognjen Sosa, CAIA, FRM, are Co-Head, Portfolio Management, Matthew Buscone; Senior Portfolio Manager Sara Chanda; Co-Head, Research, Nicholas Elfner; Co-Head, Portfolio Management, Jeffrey Glenn, CFA; Head, Municipal Trading, Benjamin Pease; and Co-Head, Research, Adam Stern, JD.)
Market Review
February saw heightened investor sentiment for an imminent federal funds rate increase, with the size of the bump (25 or 50 basis points (bps)), seemingly the remaining open question. The Federal Reserve (Fed) Open Market Committee is scheduled to meet on March 15 and 16. Complicating matters was Russia’s late-February invasion of Ukraine, which prompted financial sanctions against Russia that involved much of the global banking and broader economic sectors.
After rising and remaining higher for much of the month, Treasury yields fell at month end, reflecting increased investor desire for safe haven investments.
The Treasury curve flattened with 2-, 5-, 10-, and 30-year yields rising by 25, 11, 5 and 6bps, respectively. The spread between the 2- and 5-year spots on the Treasury curve narrowed by 15bps, while the 2s/30s curve tightened by 20bps.

At this point, events in Eastern Europe have not prompted any significant change in our strategies. For now, municipal bond credit implications are modest, as state and local government operating reserves have little-to-no exposure to Russian assets. Higher natural gas prices could impact some gas-reliant utilities, but this is a manageable risk, in our view. For most IG corporate bond issuers, borrowing costs remain around 3 percent, as 10-year Treasury yields have fallen in the days following Russia’s actions in Ukraine. The relatively low cost of debt capital should support issuance in the near-term. Some IG corporate issuers with exposure to Russia are reevaluating these assets, a process that may continue for a while. Our teams are carefully monitoring developments and assessing potential credit-related impacts to portfolios we manage.
Municipal Market Review
Increases in municipal bond yields were less substantial than Treasuries and the broad Bloomberg Municipal Bond Index outperformed the Bloomberg Treasury Index during in February (See Figure 2). Municipal/Treasury (M/T) ratios declined (See Figure 3). Municipal bond issuance was higher for the month.

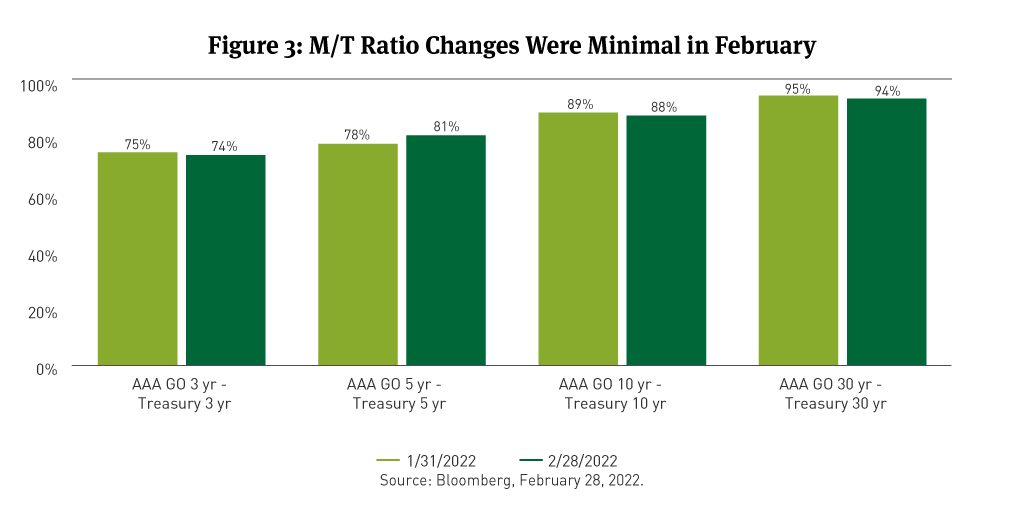
Municipal yields at 2-, 5-, 10-, and 30-years rose by 16, 12, 3, and 3bps, respectively. Both the municipal 2s/10s and 2s/30s curves flattened by 13bps.
M/T ratios fell between 1 to 3 ratios across the 2, 10 and 30-year spots while modestly increasing in 5 years.
February issuance of $26 billion was 5 percent higher than the prior month but lower than the same month one year ago, per The Bond Buyer. Tax-exempt bond issuance was 7 percent lower than February 2021, while monthly taxable issuance was nearly 80 percent lower year-over-year.
Municipal bond fund flows were negative for a second consecutive month and accelerated. Investment Company Institute data show that in February fund outflows exceeded $7 billion.
For February, the Bloomberg Managed Money Short/Intermediate (1-10) Index and the Bloomberg 1-10 Year Blend Index each fell 30bps, beating Bloomberg’s broad municipal bond and Treasury indexes. Shorter-maturity bonds tended to outperform longer maturities. The exception was the 5-year range which underperformed all spots but the long bond (22 years and longer). Municipal bonds with higher relative credit ratings outperformed bonds of lower quality.
Corporate Market Review
IG corporate bond spreads widened by 16bps in February, per Bloomberg data, to settle at 122bps. The Bloomberg U.S. Corporate Investment Grade (IG) Index fell 2.00 percent on a total return basis and 1.24 percent on an excess return basis compared with duration-matched Treasuries.
Bloomberg data showed that bonds rated AA+ fared the best across the investment grade quality spectrum, while BBB-rated bonds fared the worst. Shorter-maturity IG bonds turned in the best performance on a total return basis.
The best-performing sectors were Supranationals, Foreign Local Government, Airlines, Independent Energy, and Construction Machinery. The worst-performing sectors were Natural Gas, Gaming, Cable Satellite, Sovereigns, and Electric Utilities.
Index-eligible IG bond issuance in February, per Bloomberg, was nearly $85 billion, a decrease from about $180 billion in January. Net issuance, after redemptions, was a net negative $1.5 billion, compared with $90 billion in January. According to Citi Research and EPFR Global, IG bond funds reported approximately $1 billion of inflows in February.
Securitized Market Review
Securitized bond spreads widened in February across MBS and ABS sectors, per Bloomberg data. The broad Bloomberg MBS Index had a negative excess return of 48bps. Within MBS, spreads widened the most among the lowest and highest coupon bonds. Among ACMBS, spreads also widened, delivering a negative excess return of 22bps. CMBS had a negative excess return of 64bps, per Bloomberg data
In the ABS market segment, spreads widened 16bps and 10bps for auto loan and credit card debt, respectively. Credit card-backed securities had a negative excess return of 25bps, while securities backed by auto loans had a negative 29bps in excess return.
#286061 (3/8/2022)
DISCLAIMER
This material provides general and/or educational information and should not be construed as a solicitation or offer of Breckinridge services or products or as legal, tax or investment advice. The content is current as of the time of writing or as designated within the material. All information, including the opinions and views of Breckinridge, is subject to change without notice.
Any estimates, targets, and projections are based on Breckinridge research, analysis, and assumptions. No assurances can be made that any such estimate, target or projection will be accurate; actual results may differ substantially.
Past performance is not a guarantee of future results. Breckinridge makes no assurances, warranties or representations that any strategies described herein will meet their investment objectives or incur any profits. Any index results shown are for illustrative purposes and do not represent the performance of any specific investment. Indices are unmanaged and investors cannot directly invest in them. They do not reflect any management, custody, transaction or other expenses, and generally assume reinvestment of dividends, income and capital gains. Performance of indices may be more or less volatile than any investment strategy.
Performance results for Breckinridge’s investment strategies include the reinvestment of interest and any other earnings, but do not reflect any brokerage or trading costs a client would have paid. Results may not reflect the impact that any material market or economic factors would have had on the accounts during the time period. Due to differences in client restrictions, objectives, cash flows, and other such factors, individual client account performance may differ substantially from the performance presented.
All investments involve risk, including loss of principal. Diversification cannot assure a profit or protect against loss. Fixed income investments have varying degrees of credit risk, interest rate risk, default risk, and prepayment and extension risk. In general, bond prices rise when interest rates fall and vice versa. This effect is usually more pronounced for longer-term securities. Income from municipal bonds can be declared taxable because of unfavorable changes in tax laws, adverse interpretations by the IRS or state tax authorities, or noncompliant conduct of a bond issuer.
Breckinridge believes that the assessment of ESG risks, including those associated with climate change, can improve overall risk analysis. When integrating ESG analysis with traditional financial analysis, Breckinridge’s investment team will consider ESG factors but may conclude that other attributes outweigh the ESG considerations when making investment decisions.
There is no guarantee that integrating ESG analysis will improve risk-adjusted returns, lower portfolio volatility over any specific time period, or outperform the broader market or other strategies that do not utilize ESG analysis when selecting investments. The consideration of ESG factors may limit investment opportunities available to a portfolio. In addition, ESG data often lacks standardization, consistency and transparency and for certain companies such data may not be available, complete or accurate.
Breckinridge’s ESG analysis is based on third party data and Breckinridge analysts’ internal analysis. Analysts will review a variety of sources such as corporate sustainability reports, data subscriptions, and research reports to obtain available metrics for internally developed ESG frameworks. Qualitative ESG information is obtained from corporate sustainability reports, engagement discussion with corporate management teams, among others. A high sustainability rating does not mean it will be included in a portfolio, nor does it mean that a bond will provide profits or avoid losses.
Net Zero alignment and classifications are defined by Breckinridge and are subjective in nature. Although our classification methodology is informed by the Net Zero Investment Framework Implementation Guide as outlined by the Institutional Investors Group on Climate Change, it may not align with the methodology or definition used by other companies or advisors. Breckinridge is a member of the Partnership for Carbon Accounting Financials and uses the financed emissions methodology to track, monitor and allocate emissions. These differences should be considered when comparing Net Zero application and strategies.
Targets and goals for Net Zero can change over time and could differ from individual client portfolios. Breckinridge will continue to invest in companies with exposure to fossil fuels; however, we may adjust our exposure to these types of investments based on net zero alignment and classifications over time.
Any specific securities mentioned are for illustrative and example only. They do not necessarily represent actual investments in any client portfolio.
The effectiveness of any tax management strategy is largely dependent on each client’s entire tax and investment profile, including investments made outside of Breckinridge’s advisory services. As such, there is a risk that the strategy used to reduce the tax liability of the client is not the most effective for every client. Breckinridge is not a tax advisor and does not provide personal tax advice. Investors should consult with their tax professionals regarding tax strategies and associated consequences.
Federal and local tax laws can change at any time. These changes can impact tax consequences for investors, who should consult with a tax professional before making any decisions.
The content may contain information taken from unaffiliated third-party sources. Breckinridge believes such information is reliable but does not guarantee its accuracy or completeness. Any third-party websites included in the content has been provided for reference only. Please see the Terms & Conditions page for third party licensing disclaimers.