Investing
Commentary published on September 12, 2022
August 2022 Market Commentary
Summary
- U.S. Treasury Curve: U.S. Treasury rates were higher, especially on the short end, and the curve remained inverted out to 10-years (See Figure 1).
- Municipal Market Technicals: August issuance was nearly $34 billion, up almost 24 percent over the prior month, but fell 23 percent year-over-year driven by lower taxable and refunding supply. Mutual funds saw outflows of about $4.3 billion.
- Corporate Market Technicals: Investment grade (IG) fixed-rate bond issuance for August was nearly $135 billion. IG bond funds reported $13 billion of inflows during the month.
- Securitized Trends: Mortgage-Backed Securities (MBS) underperformed Treasuries on a total and excess return basis. The asset-backed securities (ABS) index earned positive excess returns, with a solid contributions from auto loan ABS, while total returns were negative.
(The following commentary is a summary of discussions among members of the Breckinridge Capital Advisors Investment Committee as they reviewed monthly activity in the markets and investment returns. The members of the Investment Committee under the leadership of Chief Investment Officer Ognjen Sosa, CAIA, FRM, are Co-Head of Portfolio Management, Matthew Buscone; Senior Portfolio Manager Sara Chanda; Co-Head of Research, Nicholas Elfner; Co-Head of Portfolio Management, Jeffrey Glenn, CFA; Head of Municipal Trading, Benjamin Pease; and Co-Head of Research, Adam Stern, JD.)
Market Review
After July’s respite from year-to-date negative returns and rate volatility, both returned in August. While rates increased overall, the inversion that emerged in mid-July in the short to intermediate segment persisted and increased (See Figure 1).
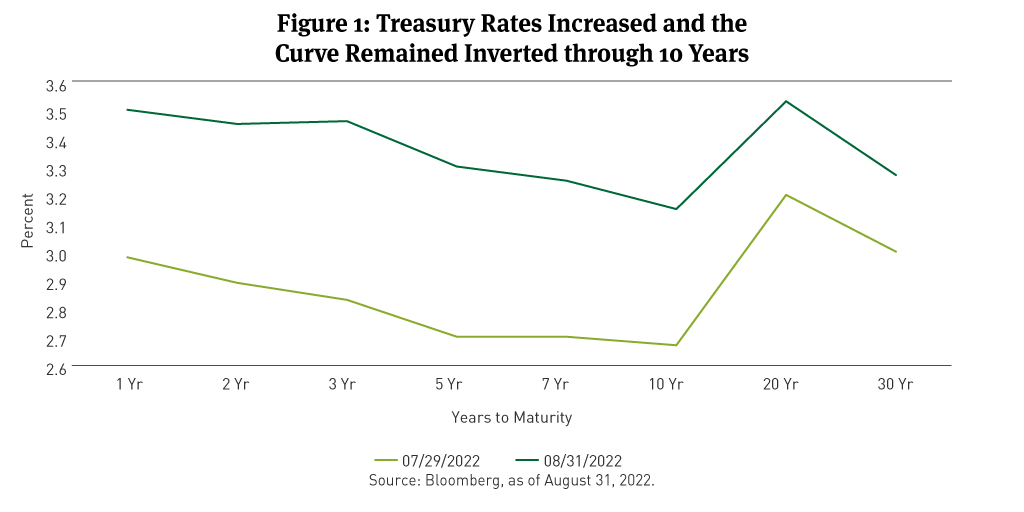
Treasury yields surged in August with the 2-year jumping over 60 basis points (bps) to close at 3.55 percent while the 10-year spiked over 50bps to 3.20 percent, marking a 2-month high.
Investors appeared to be growing more concerned about a potential recession. Comments of Federal Reserve (Fed) Chairman Jerome Powell at the end of the month indicated to many a reaffirmation of restrictive interest rate policies until inflation is lowered closer to the Fed’s 2 percent target. “While higher interest rates, slower growth, and softer labor market conditions will bring down inflation,” he said on August 26, “they will also bring some pain to households and businesses.”
The ICE/Bank of America Merrill Lynch MOVE Index1 fell from its July year-to-date highs through early August, then spiked in the second half of the month (See Figure 2). Chair Powell said in July that the Fed will be providing less forward guidance between meetings—the next scheduled Federal Open Market Committee meeting is September 20 and 21—indicating the Fed will be more data dependent in deciding future rate increases.

Data hit some discordant notes during August. For example, while inflation numbers released during the month moderated somewhat from 8 and 9 percent year-over-year increases seen earlier this year, key jobs data continued to exceed expectations. Job growth indicated sustained upward pressures on wages and prices.
A substantive driver of improved consumer confidence readings from the University of Michigan and the Conference Board appeared to be lower gas prices, which can change quickly. Institute of Supply Management and Purchasing Managers Index data in August remained in expansionary territory.
Housing starts and existing home sales offset those favorable growth indicators, trending lower in July. In contrast, as of September 1, the Federal Reserve Bank of Atlanta’s GDPNow estimate of the growth rate of real gross domestic product (GDP) for the third quarter was 2.6 percent.
It would appear that a data dependent decision in September will depend on which data is considered.
In the face of uncertainty, investors tend to retrench. During July, the S&P 500 Index fell 4.2 percent. The Bloomberg U.S. Treasury Bond Index declined 2.48 percent. The Bloomberg U.S. Aggregate Bond Index (the Aggregate) dropped 2.83 percent.
Although the advantage was small—3 basis points (bps) over AAA-rated bonds and 1bp over AA-rated bonds)—bonds rate BBB were the best performers in the Aggregate index and shorter maturities outperformed longer maturities.
Municipal Market Review
Municipal yields tracked Treasuries and increased across the curve during the month (See Figure 3). Yields rose nearly 70bps in 2-years and more than 50bps in 5-years, while the 10- and 30-year spots closed the month 38 to 40bps higher. The municipal bond yield curve inverted briefly in mid-August, as short-term yields surged. The one- to five-year inversion of five basis points happened only 10 times during the past 41 years, according to The Bond Buyer.

The curve flattened by 30bps between 2- and 10-year maturities (the 2s/10s curve), and by 28bps for the 2s/30s curve. Municipal/Treasury (M/T) ratios improved across most of the curve; the exception was 10-year where it tightened 1 ratio. (See Figure 4).

Municipal bond issuance rebounded in August more than $6 billion month-over-month but remains about 23 percent lower on a year-over-year basis, according to The Bond Buyer.
New money issuance year-to-date was 5 percent higher in August 2022 compared with the same period last year. Year-to-date refundings were off 81 percent from last year, based on data from The Bond Buyer. Mutual fund outflows remained elevated at approximately $4 billion, per Lipper/Refinitiv.
The Bloomberg Managed Money Short/Intermediate (1-10) Index declined 1.85 percent and the Bloomberg 1-10 Year Blend Index was down 1.55 percent. Shorter-maturity bonds outperformed longer-maturity issues. A rated bonds fell 2 percent but outperformed other rating categories by 15 to 46bps.
Corporate Market Review
IG corporate bond spreads tightened by 3bps, per Bloomberg data, ending August at 140bps. The Bloomberg U.S. Corporate Investment Grade (IG) Index retreated 2.93 percent on a total return basis and delivered a positive excess return of 0.08 percent compared with duration-matched Treasuries.
Reporting of quarterly corporate earnings drew to a close during August. As of August 7, Forbes, reported that companies missing estimates are unchanged this season, while those exceeding estimates gained 2.1 percent, based on FactSet data. Blended earnings, which combine actual with estimates of companies yet to report, were higher than forecasts on June 30. Six of 12 sectors, including energy, industrials, technology, health care, utilities, and consumer staples, were expected to post higher earnings when all reports have been announced. Blended revenues at the same date showed nine of 12 sectors having better results than they estimated than at the end of the quarter.
For the month of August, the best-performing sectors were airlines, financial companies, life insurance, and sovereigns. The worst-performing sectors were pharmaceuticals, health insurance, restaurants, wirelines, and media entertainment. Bonds rated AA+ fared the best and shorter maturities outperformed longer maturities.
Index-eligible IG bond issuance in August, per Bloomberg, was $134.7 billion, about $36 billion higher than July’s issuance. Net issuance, after redemptions, was $79 billion. According to Emerging Portfolio Fund Research, IG bond funds reported approximately $13 billion of inflows.
Securitized Market Review
Within securitized markets, auto loan ABS delivered a positive excess return of 42bps. Credit card ABS negative excess return was 1bp.
Following up on July’s best-ever monthly excess returns, MBS had negative excess returns when measured against duration matched Treasuries of 1 percent, according to the Bloomberg MBS Passthroughs Index. The conventional 3.5 percent coupon MBS was the worst-performing segment and the conventional 5 percent coupon, with positive excess returns of 7bps, was the best-performing segment. Conventional MBS are issued by the Federal National Mortgage Association (Fannie Mae) or the Federal Home Loan Mortgage Corporation (Freddie Mac).
Within Commercial Mortgage-Backed Securities (CMBS), agency-CMBS underperformed, with negative excess returns of 30bps, while non-agency had another strong month producing 26bps in excess returns. CMBS with 1 to 3.5 percent coupons and those rated A were the best-performing market segments.
[1] The MOVE Index measures U.S. interest rate volatility by tracking the movement in U.S. Treasury yield volatility implied by current prices of one-month over-the-counter options on 2-year, 5-year, 10-year and 30-year Treasuries. Historically, the index rises as concerns grow that interest rates are moving higher.
#305956 (9/9/2022)
DISCLAIMER
This material provides general and/or educational information and should not be construed as a solicitation or offer of Breckinridge services or products or as legal, tax or investment advice. The content is current as of the time of writing or as designated within the material. All information, including the opinions and views of Breckinridge, is subject to change without notice.
Any estimates, targets, and projections are based on Breckinridge research, analysis, and assumptions. No assurances can be made that any such estimate, target or projection will be accurate; actual results may differ substantially.
Past performance is not a guarantee of future results. Breckinridge makes no assurances, warranties or representations that any strategies described herein will meet their investment objectives or incur any profits. Any index results shown are for illustrative purposes and do not represent the performance of any specific investment. Indices are unmanaged and investors cannot directly invest in them. They do not reflect any management, custody, transaction or other expenses, and generally assume reinvestment of dividends, income and capital gains. Performance of indices may be more or less volatile than any investment strategy.
Performance results for Breckinridge’s investment strategies include the reinvestment of interest and any other earnings, but do not reflect any brokerage or trading costs a client would have paid. Results may not reflect the impact that any material market or economic factors would have had on the accounts during the time period. Due to differences in client restrictions, objectives, cash flows, and other such factors, individual client account performance may differ substantially from the performance presented.
All investments involve risk, including loss of principal. Diversification cannot assure a profit or protect against loss. Fixed income investments have varying degrees of credit risk, interest rate risk, default risk, and prepayment and extension risk. In general, bond prices rise when interest rates fall and vice versa. This effect is usually more pronounced for longer-term securities. Income from municipal bonds can be declared taxable because of unfavorable changes in tax laws, adverse interpretations by the IRS or state tax authorities, or noncompliant conduct of a bond issuer.
Breckinridge believes that the assessment of ESG risks, including those associated with climate change, can improve overall risk analysis. When integrating ESG analysis with traditional financial analysis, Breckinridge’s investment team will consider ESG factors but may conclude that other attributes outweigh the ESG considerations when making investment decisions.
There is no guarantee that integrating ESG analysis will improve risk-adjusted returns, lower portfolio volatility over any specific time period, or outperform the broader market or other strategies that do not utilize ESG analysis when selecting investments. The consideration of ESG factors may limit investment opportunities available to a portfolio. In addition, ESG data often lacks standardization, consistency and transparency and for certain companies such data may not be available, complete or accurate.
Breckinridge’s ESG analysis is based on third party data and Breckinridge analysts’ internal analysis. Analysts will review a variety of sources such as corporate sustainability reports, data subscriptions, and research reports to obtain available metrics for internally developed ESG frameworks. Qualitative ESG information is obtained from corporate sustainability reports, engagement discussion with corporate management teams, among others. A high sustainability rating does not mean it will be included in a portfolio, nor does it mean that a bond will provide profits or avoid losses.
Net Zero alignment and classifications are defined by Breckinridge and are subjective in nature. Although our classification methodology is informed by the Net Zero Investment Framework Implementation Guide as outlined by the Institutional Investors Group on Climate Change, it may not align with the methodology or definition used by other companies or advisors. Breckinridge is a member of the Partnership for Carbon Accounting Financials and uses the financed emissions methodology to track, monitor and allocate emissions. These differences should be considered when comparing Net Zero application and strategies.
Targets and goals for Net Zero can change over time and could differ from individual client portfolios. Breckinridge will continue to invest in companies with exposure to fossil fuels; however, we may adjust our exposure to these types of investments based on net zero alignment and classifications over time.
Any specific securities mentioned are for illustrative and example only. They do not necessarily represent actual investments in any client portfolio.
The effectiveness of any tax management strategy is largely dependent on each client’s entire tax and investment profile, including investments made outside of Breckinridge’s advisory services. As such, there is a risk that the strategy used to reduce the tax liability of the client is not the most effective for every client. Breckinridge is not a tax advisor and does not provide personal tax advice. Investors should consult with their tax professionals regarding tax strategies and associated consequences.
Federal and local tax laws can change at any time. These changes can impact tax consequences for investors, who should consult with a tax professional before making any decisions.
The content may contain information taken from unaffiliated third-party sources. Breckinridge believes such information is reliable but does not guarantee its accuracy or completeness. Any third-party websites included in the content has been provided for reference only. Please see the Terms & Conditions page for third party licensing disclaimers.