Municipal
Perspective published on January 3, 2022
2022 Municipal Bond Market Outlook
Summary
- The municipal bond market enters 2022 with strong credit and supportive technical conditions.
- The pace of improvement seen in 2021 is likely to slow in the new year.
- Investors should be alert to a number of challenges as the year progresses.
From a strong year-end starting point, municipal bonds will encounter risks ahead.
The municipal market enters 2022 on strong credit footing and against a supportive technical backdrop. However, the pace of credit improvement is likely to slow throughout 2022, and there is more potential for weaker demand and increased bond supply in 2022 than in 2021.
On the credit front, the market is characterized by low default rates, an upward ratings bias, strong revenue growth, significant federal support, and recovering pension funds. The Omicron variant presents manageable credit challenges. However, the benign credit environment may weaken later in the year given emerging risks, including those related to climate change, inflation, labor shortages, disruptions to public schools, a more entrenched remote work culture, and a return to a less reliable federal funding environment, especially if Republicans retake the House or Senate in the November 2022 midterm elections.
In terms of market technicals, 2021 was characterized by strong municipal bond fund inflows (demand) and limited growth in supply. Strong inflows coupled with limited tax-exempt supply led to historically low ratios and tight credit spreads in 2021.
We expect no significant movement in ratios or spreads in 2022. Congress continues to debate higher tax rates, and new money supply is unlikely to grow meaningfully. However, periods of modestly weaker demand and increased supply are possible if the Federal Reserve (Fed) raises rates as expected, issuers continue to find value in tax-exempt refundings and taxable advance refundings, and the market experiences bouts of outflows and weak demand. We favor taking modestly more credit risk in short maturities and opportunistic buying if ratios or spreads widen.
Municipal credit fundamentals look strong
Market Strengths
- Low default rates. There were 57 municipal defaults year-to-date through November 2021. That’s lower than in 2020 (72 defaults) but higher than during the 2017-19 period.1 A total of $6.8 billion in par was in default (excluding Puerto Rico debt). All but $500 million of this amount was concentrated in higher risk sectors. A record 54 percent of defaults were in the retirement/nursing home sector (Figure 1).

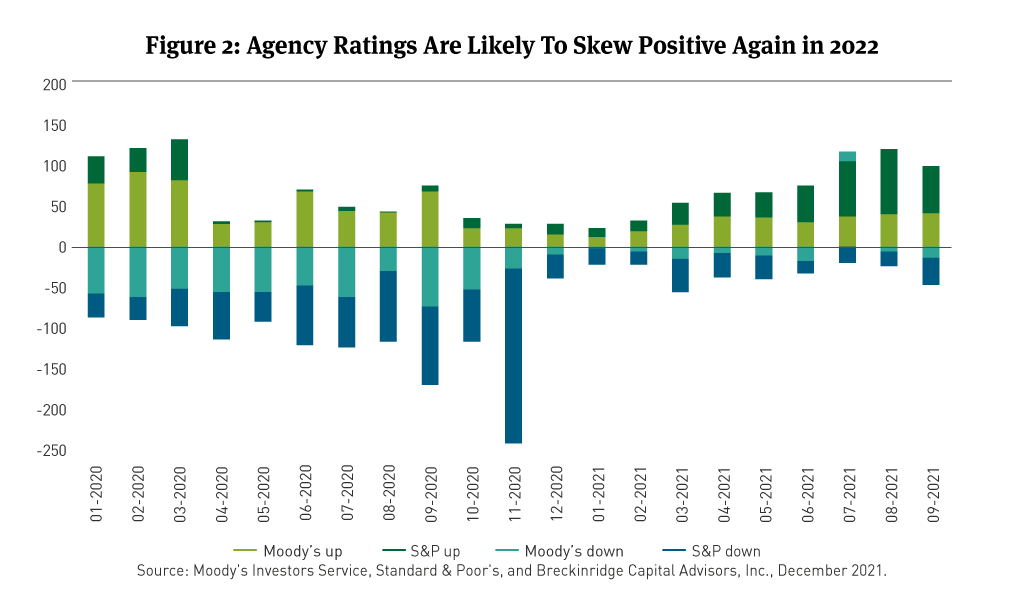
- Rating agency sentiment. Municipal rating upgrades outpaced downgrades in 2021 at both Moody’s Investors Service and Standard & Poor’s (Figure 2). The upward bias in ratings is likely to continue in 2022. Moody’s retains a positive outlook on airports, ports, and toll roads and a stable outlook on all other sectors, except hospitals.2 Nonprofit hospitals face credit pressure from staffing shortages and Medicare advances that must be repaid per the Coronavirus Aid, Relief, and Economic Security (CARES) Act.3
Standard & Poor’s has a stable outlook on all sectors except higher education.4 The higher education sector carries a negative outlook, as issuers operate in an increasingly competitive environment and face declines in enrollment and net tuition revenue.5
- Government revenue and liquidity. The largely favorable ratings environment reflects, in part, robust public sector revenue growth and liquidity. Nationwide, income- and sales-tax growth is outpacing the pre-Covid trend (Figure 3). In California, general fund cash receipts were 10 percent higher than forecasted through the first seven months of fiscal year (FY) 2022.6 In Texas, state tax collections were 29 percent higher through the first three months of FY 2022 compared to FY 2021.7 Even the two lowest rated states are reporting strong tax growth. Revenue is up 21 percent in Illinois (BBB/Baa2) for the three-month period ending in November and up 20 percent in New Jersey.8

At the local level, property tax growth is expected to remain strong, too, which should support many cities, counties, and school districts. Property tax growth tends to lag home-price growth by 1 to 3 years depending on the jurisdiction, and home-price growth was up a record 18 percent on the year through September 2021.9 The geographic breadth of home-price appreciation is also unprecedented. Home prices are up by 10 percent or more in all 50 states (Figure 4).

- Revenue sector stability. The upward bias in ratings also reflects stable financial performance in most revenue sectors. Median days cash on hand has remained largely unchanged since 2017 across several major sectors (Figure 5). Debt service coverage metrics dipped a bit in 2020 in the airport and toll road sectors but recovered in 2021 and are expected to improve further in 2022, as the pandemic wanes.

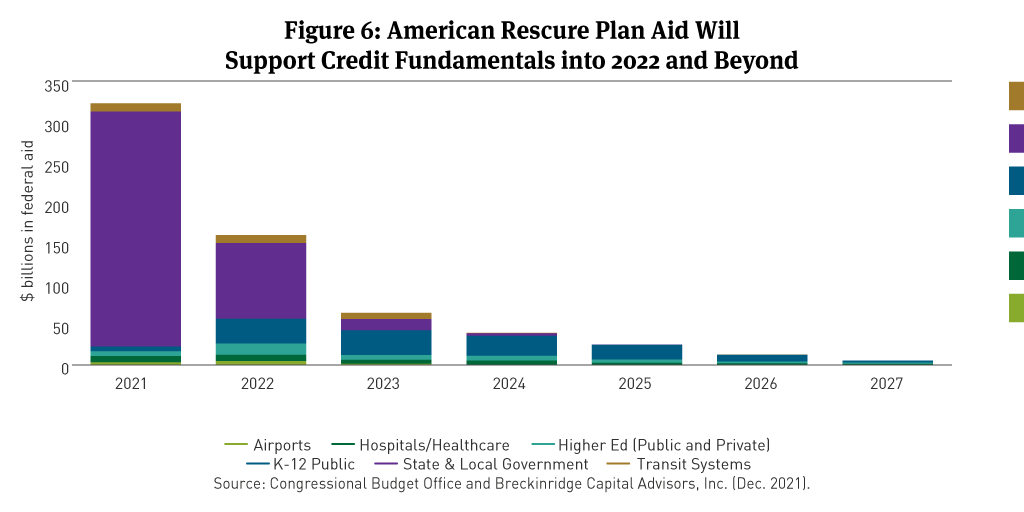
- Federal support. Extraordinary levels of federal aid for taxpayers and municipal issuers have also supported credit fundamentals. Congress enacted the Coronavirus Response and Relief Supplemental Appropriations Act in late December 2020 (CRRSA, $900 billion) and the American Rescue Plan Act in March 2021 (ARPA, $1.9 trillion). The income-support and direct aid provisions in both bills built on $2.4 trillion in funding in the March 2020 CARES Act and buoyed state and local revenues and liquidity during 2021 (See Still Work to Do for Many Municipal Issuers).
ARPA delivered $628 billion for states, local governments, and k-12 public schools through 2027 (Figure 6). The funding is meant for pandemic-related needs, including broadband, water, or sewer infrastructure, and it is intended to last for the duration of the pandemic.10 In practice, states have spent the funds cautiously and the Treasury and federal courts have loosely interpreted spending restrictions.11 ARPA funds may last a bit longer and prove more fungible than originally expected.12
In November, Congress enacted the Infrastructure Investment and Jobs Act (IIJA) which appropriates an additional $360 billion in infrastructure aid for traditional municipal issuers over five years.13 The IIJA should help issuers address deferred maintenance backlogs, reduce debt, and provide liquidity to some issuers with very large capital plans (e.g., the New York Metropolitan Transportation Authority) (See The Bipartisan Infrastructure Bill Is An Imperfect Credit-Positive for the Muni Market).
A slimmed-down version of the Build Back Better (BBB) plan may also pass in early 2022.14 As drafted, the bill includes $65 billion for the Public Housing Capital Fund, $10 billion for lead remediation in schools, and several new place-based economic development programs.15 It also includes a provision that could incent more housing bond issuance.16 Whether these elements make it into a final package is unclear.
- Better funded pension plans and endowments. Low interest rates and the rapid economic recovery have led to record stock market gains. Moody’s Investors Service expects unfunded pension liabilities will fall in 2022 alongside required annual contributions (Figure 7).17 Signs of the improved near-term outlook abound. For example, New York State officials plan to reduce the state pension fund’s return assumption while providing budget relief through lower annual contributions.18 In Connecticut, revenue outperformance has led to top-up pension contributions.19

Despite improvements, pension risk remains material for a subset of issuers. Some plans are vulnerable to an asset-price correction, and the sheer size of pension debts in several states remain a headwind for economic growth and service delivery.20 The contentious pension restructuring in Puerto Rico is also a reminder that pension debts continue to retain a strong claim relative to bonds in a municipal bankruptcy. Lastly, the recent rise in pension obligation bond (POB) issuance indicates that some issuers still prefer arbitraging their debts to paying them down.21
- Omicron is a manageable risk. The emergence of the Omicron variant seems likely to slow the ongoing economic recovery in the U.S. It may also require state and local governments to spend down reserves or ARPA funds more rapidly than planned (see above). Among sectors, nonprofit hospitals are most immediately at risk if the variant results in delayed elective procedures or exacerbates labor pressures. Temporary reversions to remote schooling and postponed office reopenings are also risks, but they are material over a longer time horizon (see below). Fundamentally, in the near-term, municipal issuers are well positioned to withstand several more months of the pandemic, especially as the country and world gain facility managing it (e.g., through vaccines, anti-viral medications, more flexible supply chains, remote work options, etc.).
Emerging risks
- Climate change. The municipal market is inching closer to a paradigm in which material climate-related risks impact credit fundamentals and, possibly, bond prices. For example, in 2021 voters in Virginia Beach approved a $568 million bond issuance to prepare local infrastructure for rising seas; the local debt burden will increase alongside the typical property tax bill, which will go up by over $115 per year.22 Recent estimates suggest that electric vehicles will comprise 53 percent of new car sales by as soon as 2030;23 debt service coverage on gas-tax backed bonds might be negatively impacted. In the American West, water shortages are likely to pressure affordability ratios and, possibly, ratings.24 To date, there is little evidence that climate risks are priced into municipal credit spreads.25 But as climate-related credit factors become more salient – and disclosure around climate change improves – investors should anticipate changes to prices.26
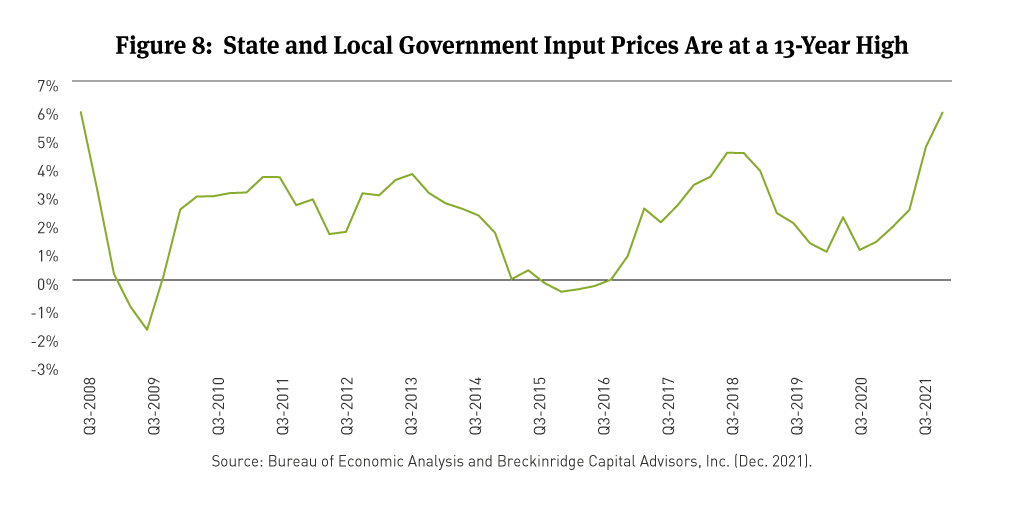
- Inflation. Market participants are increasingly concerned that recent increases in consumer and producer prices will be sustained in 2022 and beyond. Higher and sustained inflation could negatively impact municipal credit fundamentals in a variety of ways and represents a low but material risk to issuers. In Q3 2021, prices for goods and services purchased by state and local governments reached a level not seen since late 2008 (Figure 8).
On balance, a sustained period of inflation accompanied by slow growth could negatively impact municipal credit by:
(a) Pressuring issuers with tax caps. State laws often limit local governments’ ability to raise revenue for operating needs.27 If expenditures rise faster than the revenue caps permit, deficits are possible.28
(b) Reducing demand for certain modes of transportation. Commuters are likely to favor remote work options even more strongly than they do today if gas prices remain persistently high or public transit systems raise fares to offset rising operating costs. Ratings for bonds backed by per-gallon gas taxes, tolls, or farebox revenue could fall.
(c) Increasing pension liabilities. Actuaries will eventually need to assume higher annual wage increases and cost-of-living adjustments (COLAs) when calculating plan liabilities if inflation persists. Some plans might also fall short of return targets as inflation erodes nominal investment gains.29 Note, however, the degree to which inflation weakens pension health would be highly plan specific; some plans might even benefit from it.30
(d) Higher borrowing costs. The Fed would likely raise interest rates to address inflation. This could increase borrowing costs for some capital-intensive issuers, creating incentives to defer maintenance, draw on liquidity, and increase fees or taxes. Weaker borrowers that need to refinance loans taken during the pandemic might find fewer buyers; an uptick in technical and monetary defaults could follow, especially in the high-yield space.
(e) Eroding the value of reserves. Most state and local government issuers hold reserves in low yielding, safe securities per state law.31 Sustained inflation would erode the value of these reserves without statutory changes.
- Labor shortages. State and local governments are struggling to find workers (Figure 9).32 Prolonged labor shortages could result in higher operating costs, degraded services, and greater inequity between resourced and under-resourced communities. Note that the U.S. public sector workforce is older than its private sector counterpart, and older workers are returning to the labor force more slowly than those in other age groups; some may not return.33 Also, many public sector workers are exhausted from the pandemic and its related social stresses. Roughly 25 percent of teachers and 40 percent of principals express a desire to leave their jobs over the next few years.34 Police departments are struggling to retain and recruit officers.35 Even the finance professionals in charge of distributing ARPA funds are in short supply.36

- Disruption to public schools. The pandemic has contributed to lower k-12 public school enrollment and test scores, especially in districts that relied predominantly on remote learning during the 2020-21 school year.37 Both trends threaten negative credit consequences if they are sustained.
Public schools lost 3 percent of their students in the 2019-20 school year and enrollment appears to have fallen again in 2021 for many districts.38 Notably, private, parochial, public charter schools, and home-schooling arrangements have gained students at public schools’ expense.39
Disenrollment trends of this sort introduce at least two credit concerns. First, districts receive less state aid when enrollment falls.40 Deficits can ensue when state funds attached to enrollment fall faster than expenditures can be cut. Second, school districts are legislated monopolies that serve a captive group of students. To the degree that disenrollment trends reflect a newly competitive landscape among charter, private, parochial, and traditional k-12 public schools, it is a credit-negative development.
Falling test scores also portend credit challenges. Educational quality is associated with stronger long-run economic growth.41 It is also positively correlated with local housing values; communities with good schools will tend to experience stronger tax-base growth, and vice versa.42 To the degree that remote-learning loss goes unrecovered, potential growth in some districts and regions of the country may be permanently lower.
Disturbingly, the pandemic may have lasting negative impacts on racial academic achievement gaps, as well. Non-white parents disproportionately favored remote schooling options during the pandemic, even though the evidence now strongly suggests remote school was a second- (or third-) best option.43 Note that 52 percent of U.S. public school students are non-white.44 ARPA funds for schools are designed, in part, to mitigate learning loss during the pandemic. Nonetheless, the pandemic’s effect on public schools is plainly an environmental, social and governance (ESG) risk worth monitoring. - Entrenched remote work. It is becoming clearer that remote work patterns will abate slowly, if at all. In an October Gallup survey, 91 percent of Americans working in a hybrid or fully remote capacity indicated they wished to remain away from the office, partially or fully, on a permanent basis.45 As we discussed in last year’s municipal bond market outlook, a persistent remote work culture is a credit negative for mass transit systems, urban real estate, higher ed issuers, and high cost-of-living metro areas. On the latter point, updated Census figures suggest the pandemic accelerated pre-pandemic inter-state migration trends. Higher cost, older, and oil-reliant states generally lost residents to lower costs areas in 2021, but at a more rapid clip.46
- Less reliable federal funding environment. The extraordinary degree of fiscal support during the pandemic for individuals and municipal issuers may not endure. Although ARPA and IIJA funds will support credit quality in 2022 and the subsequent couple of years (see Figure 6), the pace of that support is scheduled to decline. In addition, republicans are favored to retake the House of Representatives in the 2022 midterm elections. That could result in altered spending plans and more budget brinksmanship, including over the debt limit.47 Lastly, any upward pressure on interest rates stemming from inflationary pressures would make federal budget choices more difficult for Congress. All of the above presents risks for municipal investors. The state and local government sector is now more reliant on federal aid to support revenues (indirectly via transfer payments) and spending than at any point in U.S. history (Figure 10).48

Market Technicals
Demand. Demand should remain a tailwind for valuations in 2022. The market finished 2021 with over $100 billion in mutual fund inflows, and there are few reasons to expect a reversal.49 Retiring baby boomers remain interested in municipals’ historical reputation for safety, reliability, and tax-free income. Higher tax rates also remain a possibility. The BBB plan includes surcharges on very high-income individuals (>$10 million) and corporations.50 A scaled down version of the BBB plan may pass in early 2022.
Nonetheless, the likelihood that demand weakens is higher in 2022 than it was in 2021. The Fed plans multiple interest rates hikes in 2022. Inflation is also a risk. If rates or inflation move higher or faster than expected, municipal bond funds might experience outflows. Recall that households comprise 75 percent of demand and these retail buyers sometimes get skittish when rates rise and fund flows reverse for sustained periods.51 Foreign buyers have become more interested in the municipal market in recent years, but they remain a small portion of overall demand (3 percent52).

Supply. Published supply estimates range from $440 billion (Barclays) to $550 billion (Bank of America). The wide range of estimates reflects unsettled market views regarding the path for interest rates and the degree to which issuers can save by refinancing via tax-exempt current refundings versus taxable advance refundings. We lack a high conviction view on a specific supply figure for tax-exempts or taxable bonds in 2022, but we expect rates to remain range bound.
That said, investors should anticipate that the pool of tax-free bonds may grow slowly, again, in 2022. The elimination of tax-exempt advance refundings in the Tax Cuts and Jobs Act (2017) has led to stagnant tax-exempt issuance, as issuers have opted to refinance debt via taxable advance refundings as opposed to tax-exempt current refundings. (Figure 12). Taxable advance refundings became economical in Q3 2019.

We also expect only limited new money supply. Many issuers are likely to use IIJA funds to offset planned borrowing. The IIJA authorized no new funding stream like an increased federal gas tax that could be leveraged for new projects, and issuers are likely to be sensitive to tax or fee increases given the inflationary environment. Historically, higher input costs slow the pace of municipal capital spending.53
Ratios and Spreads
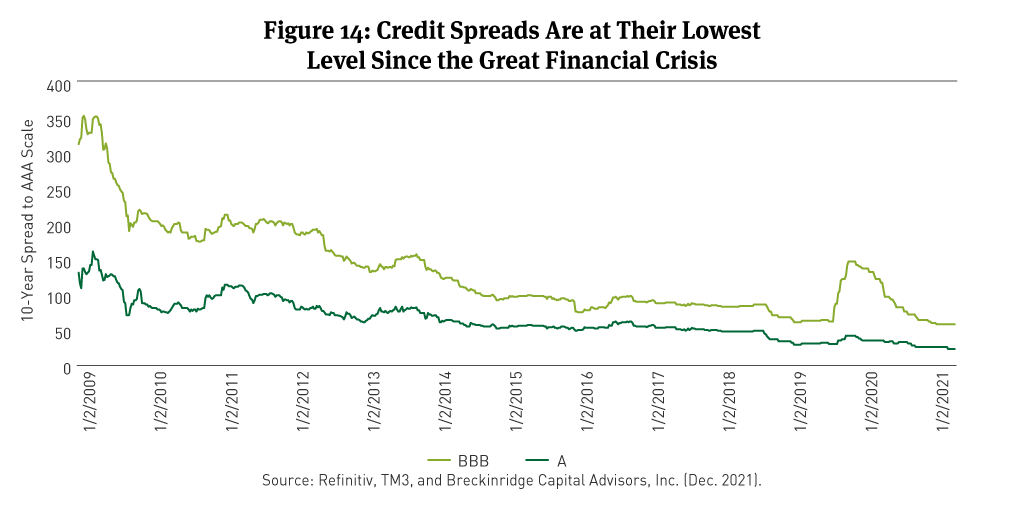
Municipal/Treasury (M/T) ratios and credit spreads are likely to remain range bound in in 2022. Ratios reached record lows in 2021 (Figure 13), and credit spreads are at their post-insured market lows (post-2009), as well (Figure 14). However, throughout the year, there may be periods during which modestly weaker demand overlaps with increased supply. In these situations, we favor opportunistic buying on the likelihood that ratios or spreads widen. Additionally, given the near-term credit backdrop, high-grade investors can likely accept modestly more risk in some essential service names in short maturities.

[1] Municipal Market Advisors, Default Trends, December 1, 2021.
[2] U.S. Public Finance Credit Outlook, Moody’s Investors Service, December 8, 2021.
[3] U.S. Public Finance Credit Outlook, Moody’s Investors Service, December 8, 2021.
[4] U.S. Public Finance 2021 Year in Review: Growth, And Stimulus, Supported Ratings, December 9, 2021.
[5] U.S. Not-for-profit Public College and University Fiscal 2020 Median Ratios: The Pandemic Presents New Challenges In An Increasingly Competitive Landscape, Standard & Poor’s, June 23, 2021.
[6] State of California Department of Finance, Economic and Revenue Update, February 2021.
[7] State of Texas, Monthly State Revenue Watch, updated December 2021.
[8] Monthly Collections Remitted to the State Comptroller (IL), available at: https://www2.illinois.gov/rev/research/taxstats/CollectionsComptroller/Pages/default.aspx; New Jersey Office of Revenue and Economic Analysis, monthly revenue reports.
[9] Breckinridge analysis of US Census of Governments property tax data.
[10] See Treasury’s guidance and the Interim Final Rule here: https://home.treasury.gov/policy-issues/coronavirus/assistance-for-state-local-and-tribal-governments/state-and-local-fiscal-recovery-funds.
[11] See: Mark Joffe, “Disclosures reveal state and local governments haven’t spent federal rescue funds,” Reason Foundation, October 11, 2011. Available at: https://reason.org/commentary/disclosures-reveal-state-and-local-governments-havent-spent-federal-rescue-funds/. For a sense of the breadth of state’s spending priorities, see the National Conference of State Legislature’s summary page here: https://www.ncsl.org/research/fiscal-policy/arpa-state-fiscal-recovery-fund-allocations.aspx. See also: “Judge Blocks Tax Cut Rule in American Rescue Plan,” Associated Press, Nov. 16, 2021. Available at: https://www.usnews.com/news/politics/articles/2021-11-16/judge-blocks-tax-cut-rule-in-american-rescue-plan.
[12] For example, the Center on Budget and Policy Priorities has found that states have spent $111 billion of the $195 billion appropriated to them. Tony Room, “Lawmaker, business leaders begin to raise alarms about dwindling federal aid,” Washington Post, December 19, 2021. Available at: https://www.bostonglobe.com/2021/12/19/nation/lawmakers-business-leaders-begin-raise-alarms-about-dwindling-federal-aid/.
[13] Breckinridge estimate based on an analysis of the Infrastructure Investment and Jobs Act. See Breckinridge Perspective: “The Bipartisan Infrastructure Bill is an Imperfect Credit-positive for the Muni Market,” August 17, 2021. Available at: https://breckinridge.dev.fastspot.com/insights/details/the-bipartisan-infrastructure-bill-is-an-imperfect-credit-positive-for-the-muni-market/
[14] Senator Manchin pulled his support from the deal in late December citing deficit concerns. However, we believe that failure to pass some legislation is too politically risky for the President and Congressional Democrats in advance of the 2022 midterm elections. An amended version of the bill may, therefore, pass in some form or, perhaps, some of its elements will pass in parts. Note that polling suggests the bill’s individual elements are popular. See Monmouth University Poll, Dec. 2-6 (2021), questions 7-9. Available at: https://www.monmouth.edu/polling-institute/reports/monmouthpoll_us_120821/.
[15] See sections 40001 and 30301. Overall, the plan appropriates $1.3 trillion. Its biggest line items include tax incentives and spending provisions that will benefit the muni market, but mostly indirectly. This includes an extension of 2021’s expanded child tax credit, financing universal pre-school and early childhood grants, and funding a variety of green energy initiatives (see: “Estimated Budgetary Effects of Title XIII, Committee on Ways and Means, HR 5376, the Build Back Better Act, November 18, 2021, especially sections 137102, 23001, 23002). See also: Mark Muro, Robert Maxim, Anthony F. Pipa, Yang You, and Colleen Dougherty, “The House’s Build Back Better Act is a milestone for place-based solutions,” Brookings, November 23, 2021. Available at: https://www.brookings.edu/blog/the-avenue/2021/11/23/the-houses-build-back-better-act-is-a-milestone-for-place-based-solutions/.
[16] Section 135102 temporarily reduces from 50% to 25% the amount tax-free bonds that must be issued in conjunction with an affordable housing project in order to unlock low-income housing tax credits. This provision may allow some states to deploy their private activity bond volume cap more effectively. See also: https://www.reuters.com/legal/legalindustry/affordable-housing-build-back-better-act-2021-11-12/.
[17] “Median- Pension and OPEB liabilities up ahead of decline in 2022,” Moody’s Investors Service, September 30, 2021. Unfunded pension liabilities measured by Moody’s ANPL. Annual costs measured using Moody’s “tread water” metric.
[18] See: https://www.osc.state.ny.us/press/releases/2021/08/dinapoli-announces-reduction-employer-contribution-rates-retirement-system.
[19] See: https://ctmirror.org/2021/09/28/ct-poised-to-take-1-6-billion-chunk-out-of-pension-debt/ and https://ctmirror.org/2021/07/07/ct-public-sector-pensions-are-prime-beneficiary-of-federal-covid-relief-grants/.
[20] For example, in CT, KY, IL, and NJ.
[21] Breckinridge analysis of Bloomberg data. There has been roughly $8 billion in POB issuance in 2021.
[22] “Virginia Beach voters approve $568 million bond to fend off rising sea levels,” PBS News Hour, November 3, 2021. Available at: https://www.pbs.org/newshour/politics/virginia-beach-voters-approve-568-million-bond-to-fend-off-rising-sea-levels.
[23] McKinsey estimates that 53 percent of vehicles sold in the U.S. will be battery powered EVs (BEVs) by 2030 (base case). See: https://www.mckinsey.com/industries/automotive-and-assembly/our-insights/a-turning-point-for-us-auto-dealers-the-unstoppable-electric-car.
[24] “Rate Affordability Could be Pressured As US Public Utilities Tackle Aging Infrastructure And Climate Considerations,” Standard & Poor’s, December 15, 2021.
[25] Kodra, “The U.S. Municipal Bond Market Does Not Price in Physical Climate Risk… Yet,” medium.com. Available at: https://risq-inc.medium.com/the-u-s-municipal-bond-market-does-not-price-in-physical-climate-risk-yet-cb09118809b4.
[26] Climate-related risks are spurring demand from regulators investors, and issuers for more standardization around the disclosure of material ESG risks. In 2021, the Municipal Securities Rulemaking Board (MSRB) published a Request for Information (RFI) soliciting input on how best to disclose muni-related ESG risks. The National Association of Bond Lawyers (NABL) acknowledged that material climate risks ought to be disclosed in bond offering statements, and the Government Finance Officers’ Association published a “best practices” document for disclosure of environmental “E” risks for municipal issuers. In addition, there are now two reputable data providers for CUSIP-linked climate information in the municipal bond space: RisQ and DPC Data. Each enables investors to better grasp the physical climate risks (and soon, transition risks) associated with individual obligors. See: MSRB Notice 2021-17, published December 8, 2021, National Association of Bond Lawyers, September 9, 2021 comments submitted to the SEC re: climate change disclosures and the Government Finance Officer Association’s recommendations for best practices in environmental “E” disclosures (available at: https://www.gfoa.org/materials/esg-disclosure).
[27] “Local Tax Limitations Can Hamper Fiscal Stability of Cities and Counties,” Pew Trusts, July 2, 2021. Available at: https://www.pewtrusts.org/en/research-and-analysis/issue-briefs/2021/07/local-tax-limitations-can-hamper-fiscal-stability-of-cities-and-counties.
[28] For example, in California, Proposition 13 restricts local property tax increases to 2 percent per year in most communities. (Note that some issuers operate with expenditure caps; these governments might benefit from inflation. Expenditure-growth would be capped while revenues could grow alongside inflation. As outlined at the beginning of the section, on balance, stagflation poses risks to the muni market. But some credits will do better than others.)
[29] These conclusions are based on a variety of sources, including Breckinridge’s engagement with public pension actuaries. For a very brief summary of some impacts of inflation on public pension plans, see: Girard Miller, “Public Pensions New Inflation Dilemma,” Governing.com, September 10, 2020. Available at: https://www.governing.com/finance/public-pensions-new-inflation-dilemma.html.
[30] Note that inflation must be sustained to have a meaningfully impact. In the short-term (perhaps 1-2 years), pension system health would not likely change much. Wage assumptions are slow to change as collective bargaining agreements last for several years and must expire before renegotiation is possible. Also, some pension systems offer no COLAs; these funds might benefit from rising inflation as the real cost of benefits declines. Lastly, if interest rates rise in response to higher inflation, it could even reduce liabilities; on paper, every one percent rise in interest rates should reduce liabilities by ≈11 percent in a fund with a 11-year duration.
[31] For example, see: Connecticut General Statutes, Sec. 3-27d which outlines eligible investments for the state’s Short Term Investment Fund.
[32] Bureau of Labor Statistics. Per the latest Current Population (Table A-31) and JOLTS surveys, there were 775,000 jobs available on state and local government sector payrolls in October 2021 (seasonally adjusted) versus 415,000 government wage and salary workers in November 2021. Also, states are taking a lead on increasing wages in recognition of the shortage: https://www.pewtrusts.org/en/research-and-analysis/blogs/stateline/2021/12/21/desperate-for-state-workers-governors-offer-raises-to-keep-them.
[33] “Amara Omeokwe, “Covid-19 Pushed Many Americans to Retire. The Economy Needs Them Back,” Wall Street Journal, October 31, 2021. Note that the public sector workforce skews older. The median public sector worker in the U.S. is 45.6 years old, more than three years older than the national average. The labor force participation rate for workers 55+ was 38.4 percent in November 2021, down from 40.3 percent pre-pandemic. Bureau of Labor Statistics, Current Population Survey, Characteristics of the Employed, 2020, Tables 18b and Table A-9.
[34] Zamarro, Camp, Fuchsman, and McGee, “How the pandemic has changed teachers’ commitment to remaining in the classroom,” Brookings, September 8, 2021, Michelle Goldberg, “We Desperately Need School to Get Back to Normal,” New York Times, December 17, 2021.
[35] Meghan Roos, “America’s Most Dangerous Cities Grapple With Police Shortfall in Recruitment, Retention,” Newsweek, December 17, 2021. Available at: https://www.newsweek.com/top-us-crime-cities-grapple-police-shortfall-recruitment-retention-1660779.
[36] “Wave of Public Finance Retirements to Worsen Worker Shortage,” Bloomberg.com, September 21, 2021.
[37] Halloran, Jack, Okun, and Oster, “Pandemic Schooling Mode and Student Test Scores: Evidence from U.S. States, NBER Working Paper 29497, November 2021. Available at: https://www.nber.org/papers/w29497.
[38] Kamenetz, Turner, Khurana, “Where are the students? For a second straight year, school enrollment is dropping,” National Public Radio. Available at: https://www.npr.org/2021/12/15/1062999168/school-enrollment-drops-for-second-straight-year.
[39] See March 2021 U.S. Census Household Pulse Survey. Available at: https://www.npr.org/2021/12/15/1062999168/school-enrollment-drops-for-second-straight-year.
[40] See Moody’s Investors Service k-12 school district methodology, June 22, 2020. From page 8: “Steep enrollment declines can drive credit deterioration if revenue stagnates or declines at a faster pace than the school district can reduce expenditures. Because enrollment figures are incorporated into most state funding formulas, negative enrollment trends result in funding declines for many school districts.”
[41] Hanusheck, Woessman, “Education and Economic Growth,” Economics of Education, 2010. Available at: http://hanushek.stanford.edu/publications/education-and-economic-growth
[42] Jonathan Rothwell, Housing Costs, Zoning, and Access to High-Scoring Schools,” Brookings, April 19, 2012. Available at: https://www.brookings.edu/research/housing-costs-zoning-and-access-to-high-scoring-schools/.
[43] “Remote control,” More non-white than white parents prefer remote learning for their children,” Economist.com, March 14, 2021: https://www.economist.com/united-states/2021/03/14/more-non-white-than-white-parents-prefer-remote-learning-for-their-children
[44] U.S. Census, October 19, 2021 estimates. Available at: https://www.census.gov/data/tables/2020/demo/school-enrollment/2020-cps.html.
[45] Saad and Wigert, “Remote Work Persisting and Trending Permanent,” Gallup.com, October 13, 2021. Available at: https://www.economist.com/finance-and-economics/2021/10/30/remote-first-work-is-taking-over-the-rich-world.
[46] For example, California lost 367,299 residents to other states in 2021 (July 1, 2020 to July 1, 2021) while Texas, a lower cost state, gained 170,307. Interstate migration patterns reflect a mix of factors, including tax environment, cost-of-living, location of family, weather, mass retirement in the baby boom generation, oil prices, and remote work options during the pandemic. Data is available at: https://www.census.gov/data/datasets/time-series/demo/popest/2020s-state-total.html.
[47] Republicans are favored for at least four reasons. First, midterm elections typically favor the party out-of-power. Second, Republicans control the Congressional redistricting process to a greater degree than Democrats. Third, the president’s approval rating is low, by historical standards, which also influences midterm election results. Fourth, generic ballot results are also strongly favoring Republicans. For more, see: Epstein and Corasaniti, “Republicans Gain Heavy House Edge in 2022 as Gerrymandered Maps Emerge,” New York Times, November 17, 2021, and FiveThirtyEight.com: https://projects.fivethirtyeight.com/congress-generic-ballot-polls/.
[48] The degree of federal aid in the form of transfer payments and Medicaid is likely to decline in 2022-23 and beyond. But it will remain at a historically high level. Note, as well, that the figures shown in fig. 10 exclude any provisions of the Build Back Better plan. That bill includes an expansion of the enhanced Child Tax Credit and several provisions to expand access to health insurance. For the latter provisions, see: https://www.kff.org/health-costs/issue-brief/potential-costs-and-impact-of-health-provisions-in-the-build-back-better-act/.
[49] Investment Company Institute (ICI) data through December 15, 2022.
[50] In its latest iteration, among other things, the Build Back Better plan included a 5 percent surcharge on modified adjusted gross income (MAGI) in excess of $10 million and an additional 3 percent surcharge on MAGI in excess of $25 million. It applies the 3.8 percent Net Investment Income Tax (NIIT) to certain pass-through business owners. It increases the state and local tax deduction limit from $10,000 to $80,000, and it creates a minimum corporate income tax based on the “book” income of corporations with at least $1 billion in profits. For a nice synopsis, see: “House Build Back Better Act: Details & Analysis of Tax Provisions in the Budget Reconciliation Bill,” Tax Foundation, December 2, 2021. Available at: https://taxfoundation.org/build-back-better-plan-reconciliation-bill-tax/.
[51] Federal Reserve Flow of Funds data for 75 percent figure.
[52] Federal Reserve Flow of Funds.
[53] Conclusion based on Breckinridge analysis of Bureau of Economic Analysis and Census data.
Rev#279368 (1/8/2021)
DISCLAIMER
This material provides general and/or educational information and should not be construed as a solicitation or offer of Breckinridge services or products or as legal, tax or investment advice. The content is current as of the time of writing or as designated within the material. All information, including the opinions and views of Breckinridge, is subject to change without notice.
Any estimates, targets, and projections are based on Breckinridge research, analysis, and assumptions. No assurances can be made that any such estimate, target or projection will be accurate; actual results may differ substantially.
Past performance is not a guarantee of future results. Breckinridge makes no assurances, warranties or representations that any strategies described herein will meet their investment objectives or incur any profits. Any index results shown are for illustrative purposes and do not represent the performance of any specific investment. Indices are unmanaged and investors cannot directly invest in them. They do not reflect any management, custody, transaction or other expenses, and generally assume reinvestment of dividends, income and capital gains. Performance of indices may be more or less volatile than any investment strategy.
Performance results for Breckinridge’s investment strategies include the reinvestment of interest and any other earnings, but do not reflect any brokerage or trading costs a client would have paid. Results may not reflect the impact that any material market or economic factors would have had on the accounts during the time period. Due to differences in client restrictions, objectives, cash flows, and other such factors, individual client account performance may differ substantially from the performance presented.
All investments involve risk, including loss of principal. Diversification cannot assure a profit or protect against loss. Fixed income investments have varying degrees of credit risk, interest rate risk, default risk, and prepayment and extension risk. In general, bond prices rise when interest rates fall and vice versa. This effect is usually more pronounced for longer-term securities. Income from municipal bonds can be declared taxable because of unfavorable changes in tax laws, adverse interpretations by the IRS or state tax authorities, or noncompliant conduct of a bond issuer.
Breckinridge believes that the assessment of ESG risks, including those associated with climate change, can improve overall risk analysis. When integrating ESG analysis with traditional financial analysis, Breckinridge’s investment team will consider ESG factors but may conclude that other attributes outweigh the ESG considerations when making investment decisions.
There is no guarantee that integrating ESG analysis will improve risk-adjusted returns, lower portfolio volatility over any specific time period, or outperform the broader market or other strategies that do not utilize ESG analysis when selecting investments. The consideration of ESG factors may limit investment opportunities available to a portfolio. In addition, ESG data often lacks standardization, consistency and transparency and for certain companies such data may not be available, complete or accurate.
Breckinridge’s ESG analysis is based on third party data and Breckinridge analysts’ internal analysis. Analysts will review a variety of sources such as corporate sustainability reports, data subscriptions, and research reports to obtain available metrics for internally developed ESG frameworks. Qualitative ESG information is obtained from corporate sustainability reports, engagement discussion with corporate management teams, among others. A high sustainability rating does not mean it will be included in a portfolio, nor does it mean that a bond will provide profits or avoid losses.
Net Zero alignment and classifications are defined by Breckinridge and are subjective in nature. Although our classification methodology is informed by the Net Zero Investment Framework Implementation Guide as outlined by the Institutional Investors Group on Climate Change, it may not align with the methodology or definition used by other companies or advisors. Breckinridge is a member of the Partnership for Carbon Accounting Financials and uses the financed emissions methodology to track, monitor and allocate emissions. These differences should be considered when comparing Net Zero application and strategies.
Targets and goals for Net Zero can change over time and could differ from individual client portfolios. Breckinridge will continue to invest in companies with exposure to fossil fuels; however, we may adjust our exposure to these types of investments based on net zero alignment and classifications over time.
Any specific securities mentioned are for illustrative and example only. They do not necessarily represent actual investments in any client portfolio.
The effectiveness of any tax management strategy is largely dependent on each client’s entire tax and investment profile, including investments made outside of Breckinridge’s advisory services. As such, there is a risk that the strategy used to reduce the tax liability of the client is not the most effective for every client. Breckinridge is not a tax advisor and does not provide personal tax advice. Investors should consult with their tax professionals regarding tax strategies and associated consequences.
Federal and local tax laws can change at any time. These changes can impact tax consequences for investors, who should consult with a tax professional before making any decisions.
The content may contain information taken from unaffiliated third-party sources. Breckinridge believes such information is reliable but does not guarantee its accuracy or completeness. Any third-party websites included in the content has been provided for reference only. Please see the Terms & Conditions page for third party licensing disclaimers.