Municipal
Perspective published on January 4, 2021
2021 Muni Market Outlook: To Immunity and Beyond!
Summary
- Municipal credit will begin to heal in 2021 as the COVID-19 pandemic abates and the economy recovers.
- In the near-term, ratings are likely to migrate lower as issuers suffer revenue and cashflow pressure and regional recoveries diverge.
- Beyond 2021, the rise of remote work could weaken credit quality in key sectors. Long-term challenges remain in the areas of pensions, federal deficits, and ESG risk.
- Supply is likely to remain modest while demand remains strong, a positive market technical.
Municipal credit will begin to heal in 2021 as the Covid-19 pandemic abates and the economy recovers. However, the market is likely to emerge less resilient than before. In the near-term, ratings are likely to migrate lower as issuers suffer revenue and cashflow pressure and regional recoveries diverge. Beyond 2021, the rise of remote work could weaken credit quality in key sectors. Long-term challenges remain in the areas of pensions, federal deficits, and environmental, social and governance (ESG) risks like climate change.
Against this backdrop, tax-exempt supply is likely to grow modestly while demand remains strong. Municipal yields are likely to remain tethered to low Treasury yields while credit spreads remain tight. Low investment grade municipals may outperform in 2021 given market technicals but will likely be more vulnerable to future credit shocks. For high-grade investors, we favor a disciplined approach to credit picking.
Municipal credit fundamentals to begin healing, then diverge in 2021
Market strengths:
Vaccines. The distribution of multiple vaccines should drive credit stabilization in 2021. (Figure 1). The sectors most negatively impacted by the pandemic will benefit the most from mass inoculation. This includes hospitals, airports, mass transit issuers, universities, community colleges, nursing homes and issuers of hotel occupancy tax bonds, among others. Significant uncertainty remains regarding the distribution of vaccines. Notably, as of December 30, 2020, 12.4 million doses had been distributed but only 2.8 million administered.1 Still, the bias is toward more “normalcy” in 2021.2

Supportive fiscal and monetary policy. Congress passed a second large COVID-19 relief package in late December which delivers over $900 billion in aid to individuals, businesses and municipal issuers.3 The legislation included $82 billion for K-12 schools and higher education issuers and $45 billion for transportation issuers. President-elect Biden supports additional relief, and the Federal Reserve (Fed) intends rates to stay low for years.4
The extent of federal support will depend on the outcome of two closely contested January 5 Senate runoffs in Georgia. Most observers expect Republicans to win at least one of the seats, in which case Republicans maintain control of the Senate and support for federal spending may wane as the pandemic recedes.5 However, if Democrats win both races, that party will control both houses of Congress and substantial new spending becomes more likely.
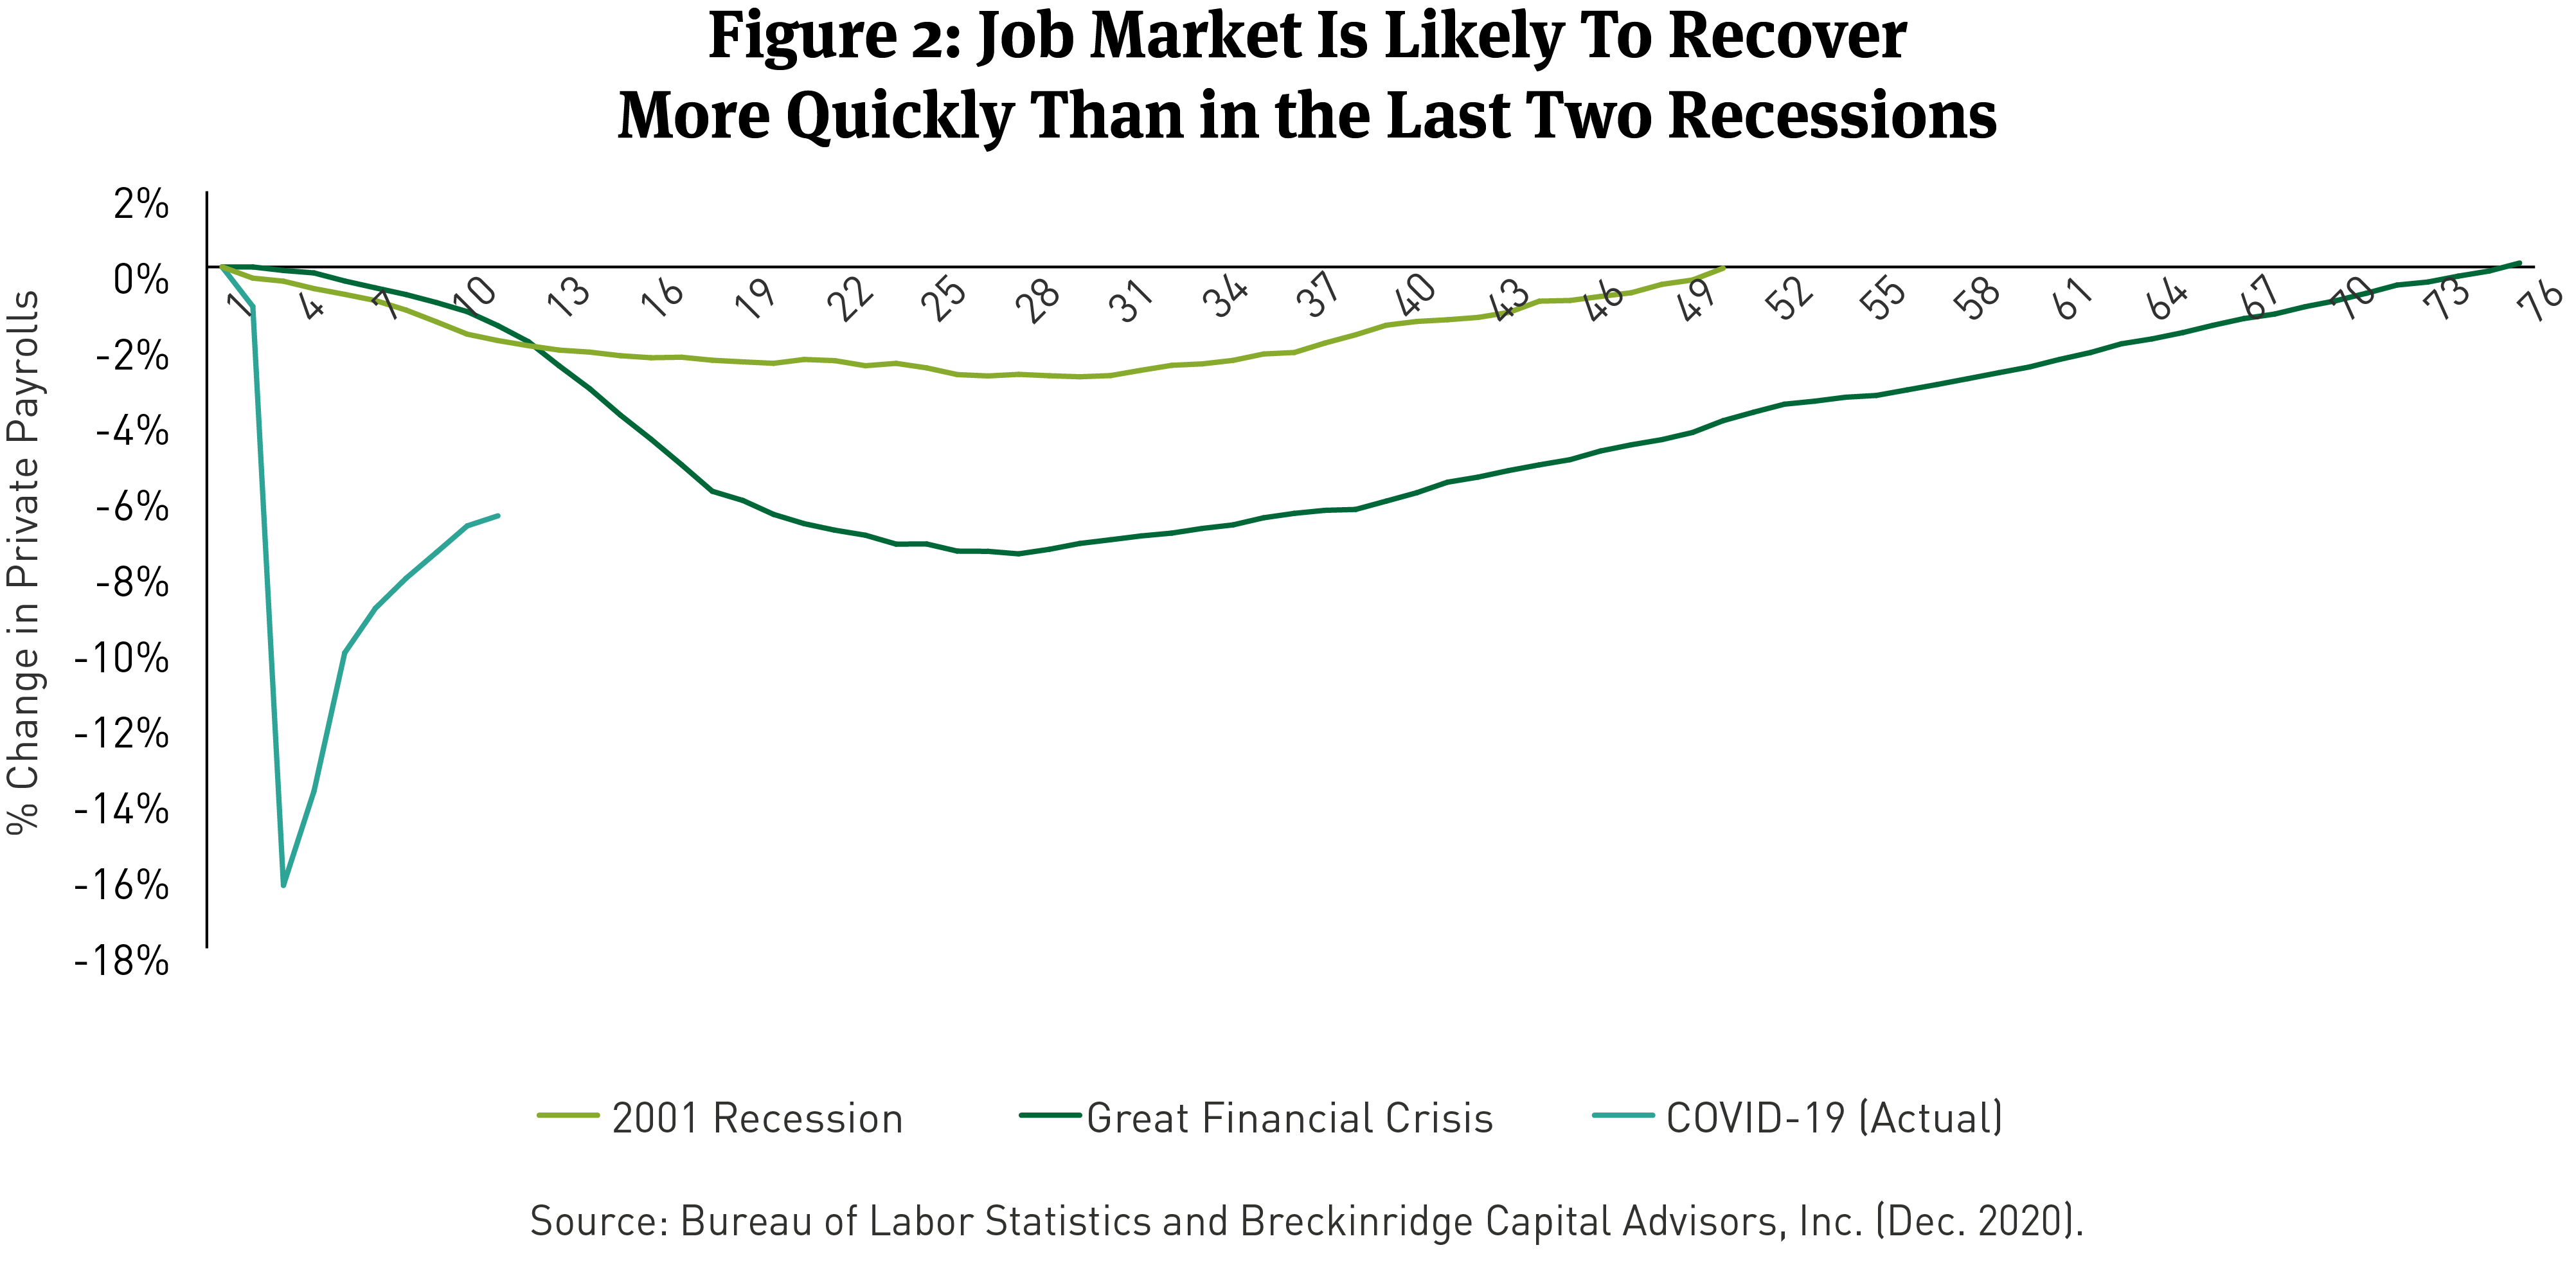
Economic growth. Healthy growth is likely after vaccines and stimulus take root. Notably, the jobs recovery may be faster than in the past two recessions (Figure 2). Growth in 1Q21 might be a bit slower before widespread inoculation manifests. However, direct checks and enhanced unemployment payments included in the late-December 2020 stimulus bill are likely to buoy incomes and consumption. As we outlined in Muni Credit and the November 2020 Elections, similar transfer payments in the CARES Act prevented significant declines in tax revenue and helped spur the summer’s V-shaped recovery.
Rising home prices. Ninety-three (93) of the nation’s largest 100 metro areas experienced annual home-price growth of 5 percent or more in 3Q20 (Figure 3). Higher residential real estate prices reflect low interest rates and demand for larger homes as more Americans choose to work remotely. Rising home prices should support local general obligation (GO) bonds and single-family housing bonds.6 The latter benefit from increased mortgage demand which should offset lower interest income and forbearance-related losses at Housing Finance Agencies (HFAs).7


Low default rates. There were only 75 municipal defaults through mid-December. That is below the highs in 2010, 2011, and 2012.8 Most of the defaults were concentrated in speculative sectors like land district financings and nursing homes. The default rate will probably remain elevated in 2021, but it is unlikely to disrupt market fundamentals.
Stable utilities. Residential demand for water, sewer and electricity service has grown during the pandemic and outpaced declines from commercial customers. Median cash-on-hand was 502 days for water and sewer utilities in fiscal year (FY) 2020 and 159 days for electric utilities. These figures are consistent with 2019 performance.9
Toll roads. Toll road traffic is returning to normal faster than in other transportation sectors. Several of the largest toll systems in the U.S. are now reporting monthly volumes exceeding 85 percent of 2019 levels.10 Moody’s Investors Service has revised its 2021 toll road outlook to stable from negative.11
More timely regional economic data. The pandemic has spurred helpful data innovations. This includes timely and regionally specific economic data through websites like Opportunity Insights (opportunityinsights.org) and mobility trackers from Google and Apple.12 It also includes new Census Pulse Surveys and the Municipal Security Research Bureau’s (MSRB) new COVID-19-related disclosure system.13 Municipal disclosure remains far from perfect, but the addition of new data sources is a positive development for investors.
Market challenges:
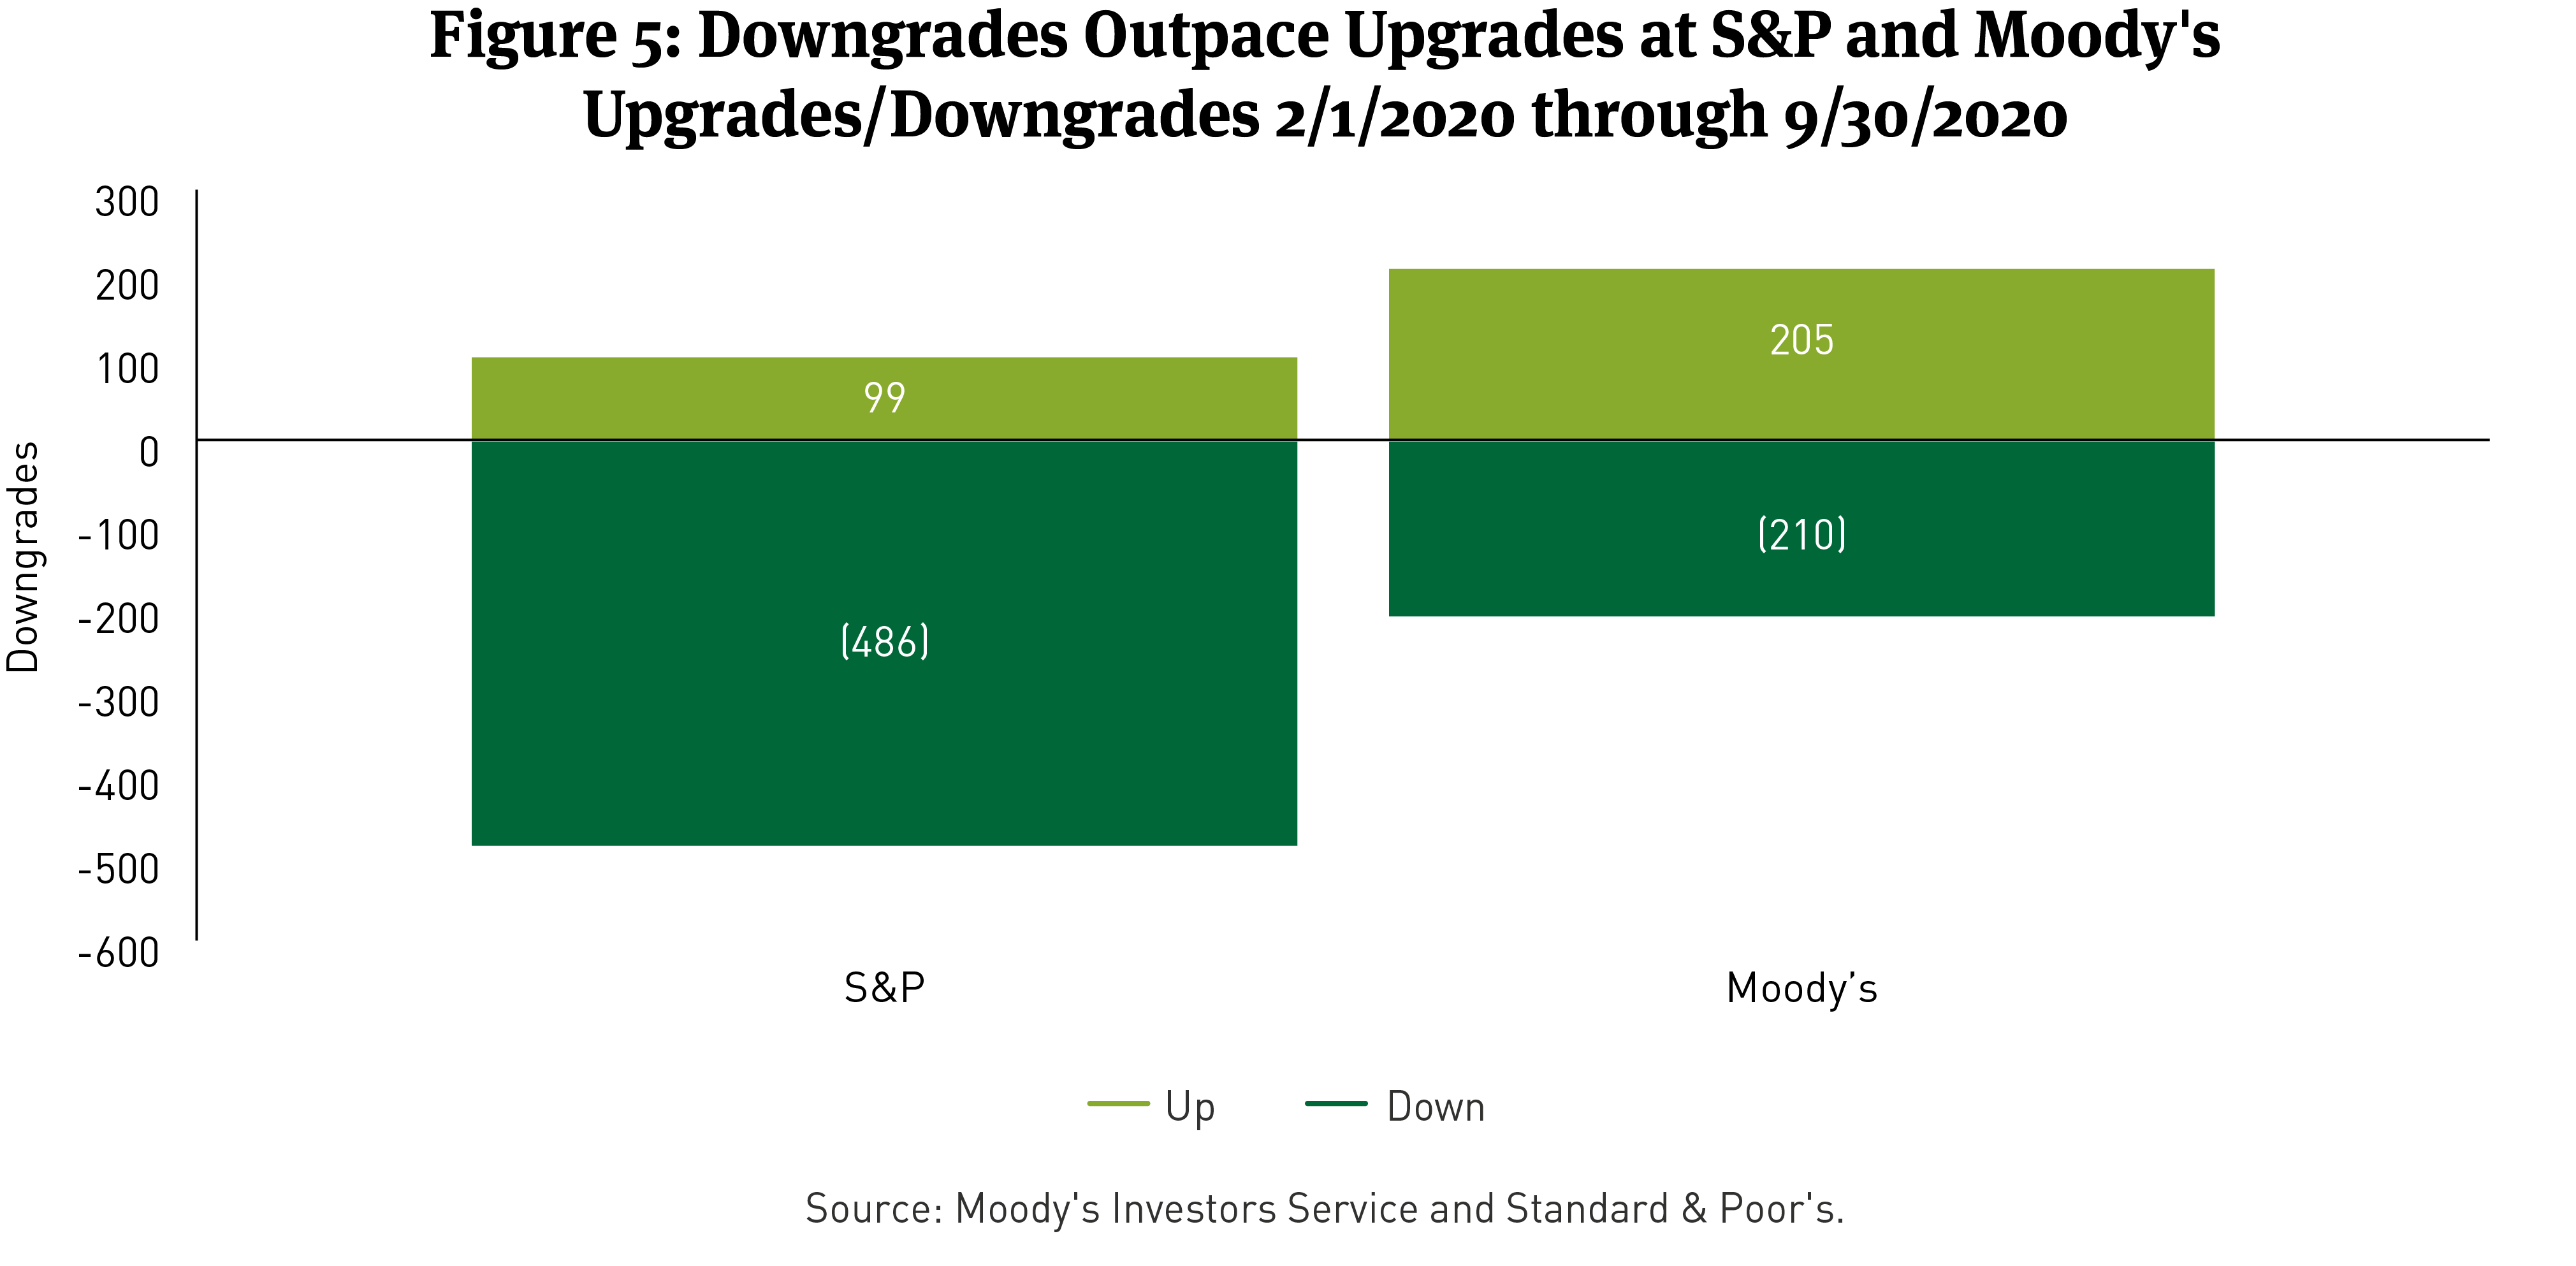
Ratings biased lower in the near-term. Outlooks remain negative across public finance sectors at S&P Global Ratings (S&P), and at Moody’s Investors Service (Moody’s), all but four sectors carry a negative outlook.14 Since the pandemic began, S&P has upgraded 99 public finance obligors and downgraded 486. Moody’s has upgraded 205 names and downgraded 210 (Figure 5).
More downgrades are likely in 2021. Notwithstanding additional federal stimulus and the strong likelihood for better economic performance, municipal revenues will remain depressed for many issuers. Nationwide, state tax revenue was down 5 percent for the six-month period ending in September 2020, compared to the same six months in 2019.15 Ninety percent (90 percent) of large cities report they will be less able to meet their fiscal needs in FY 2021 than in FY 2020.16
Cashflow will also remain strained. Some large transportation and hospital issuers have reopened commercial paper programs, secured bank lines of credit, or issued notes or bonds to bolster liquidity.17 New Jersey issued $4 billion in emergency GO bonds in November to increase reserves and finance its FY 2021 deficit.18 New York State issued $4.5 billion for similar purposes.19 Illinois and the New York MTA each borrowed twice in 2020 from the Fed’s now-closed Municipal Liquidity Facility (MLF). This debt will need to be repaid within three years per MLF rules.20 States’ cashflow pressures are likely to result in funding cuts for schools, cities, and counties. Conditions will improve in 2021, but for many issuers, ratings may settle at a lower level.
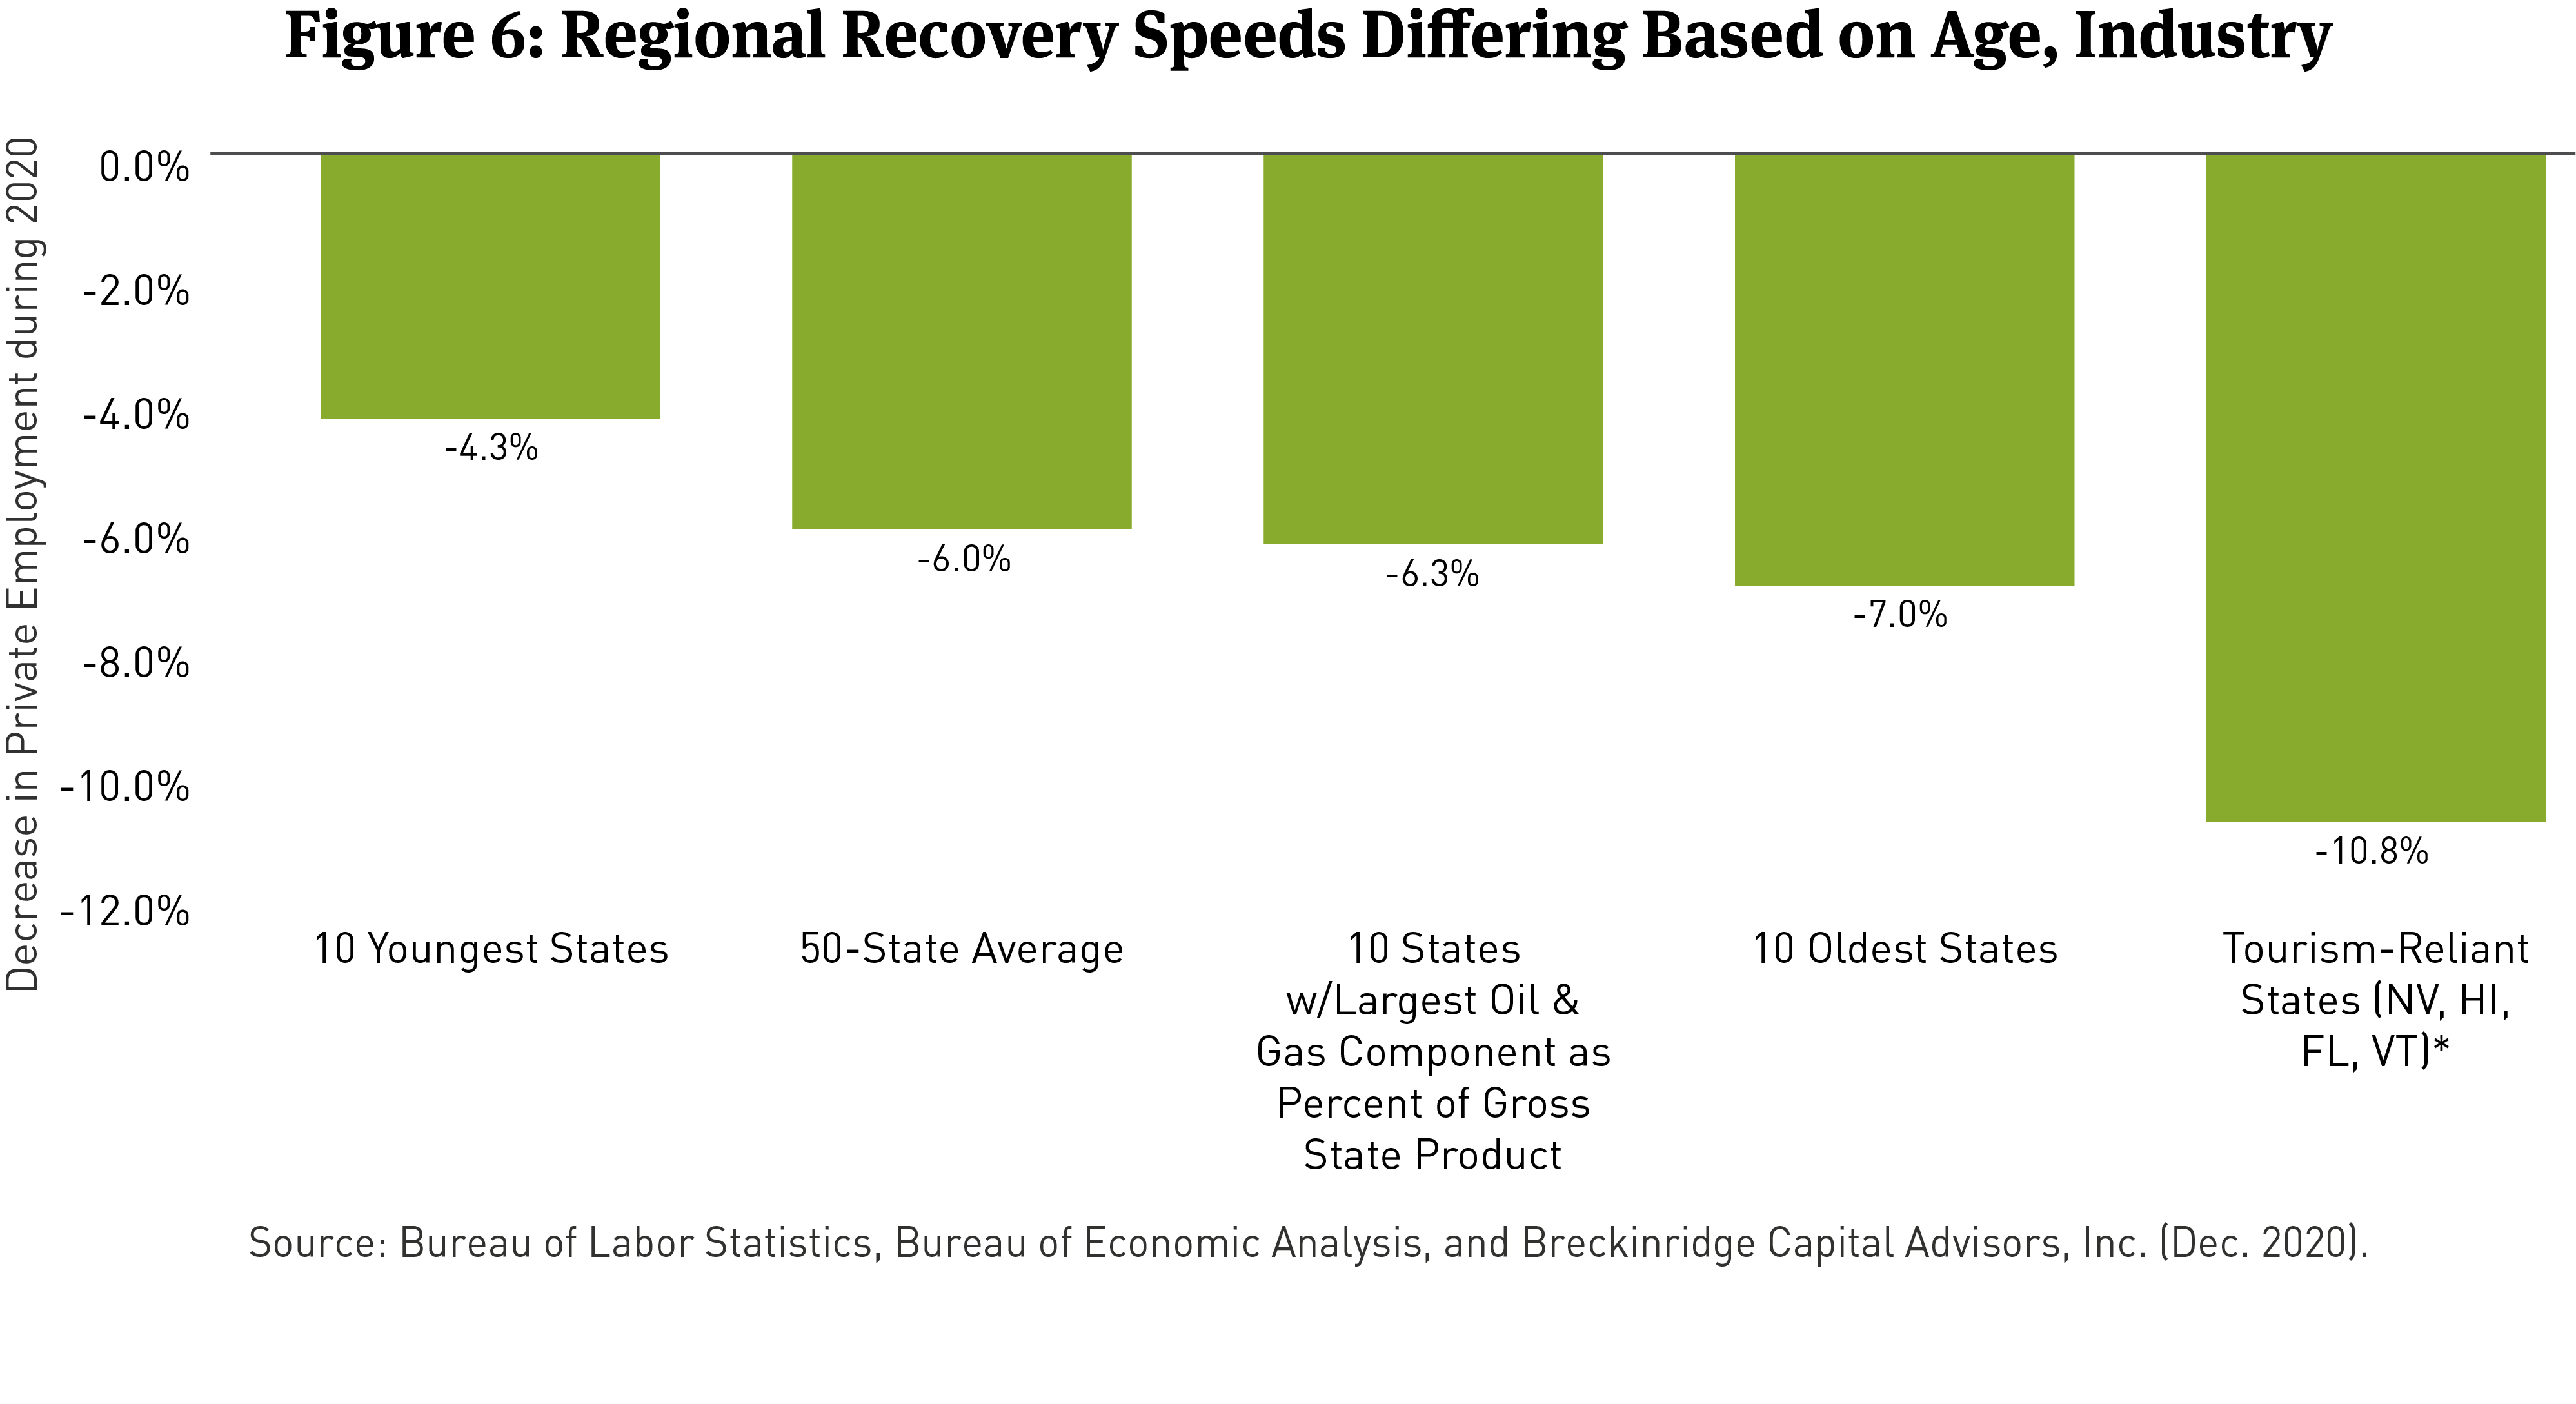
Regional recoveries will likely diverge. State labor markets tell part of this story. For example, older regions have lost more private payroll jobs than in other places (Figure 6). Labor force participation for workers age 55+ has fallen to 38.7 percent, from 40.3 percent before the pandemic; a large percentage of these workers may not return.21 Distinctive recoveries are also likely for regions dependent on oil prices and tourism. Private employment in Alaska and North Dakota is down 7.6 percent and 7.8 percent, respectively, on an annual basis through October. Private payrolls in tourism-reliant Hawaii and Nevada are down 20 percent and 8 percent, respectively.22
Regional differences in tax structure will also matter. States with diversified tax bases, progressive income tax structures, and many high-income taxpayers may recover faster. For example, California lost 8 percent of its private payrolls through October but nonetheless anticipates a 3 percent increase in income and sales taxes in FY 2021.23 By contrast, Florida lost only 4.7 percent of its private payroll jobs over the same time frame, but revenues down 3 percent through the first four months of FY 2021.24 California is home to many affluent taxpayers and a diversity of taxes, including a highly progressive income tax; Florida finances itself largely through sales taxes.
Competition from remote work present a new, longer-term risk. To the extent that remote work becomes a post-pandemic norm, at least five types of issuers could be disrupted: airports, mass transit operators, cities, higher education issuers and high-cost states and cities. Thirty-five percent (35 percent) of American workers are interested in working remotely on a permanent basis.25
- Airports. If remote workers substitute Zoom meetings for business trips, a slow recovery in airport finances is likely. Business passengers comprise 10 percent of airline passengers but as much as 75 percent of airline profits.26 When airline profits stumble, so can airport bond ratings. Airline revenue secures most airport debt. The airport sector remains remarkably liquid, and issuers have ample access to the capital markets, if needed. However, the post-pandemic economy may prove more disruptive to airports than is currently appreciated.27
- Mass transit. Remote work negatively impacts bus, subway and commuter rail operators. Prior to the pandemic, these systems generally faced limited competition and had strong pricing power over riders. Taxpayer subsidies for mass transit were generally supported. However, mass transit’s pricing power and taxpayer support may erode in a world with many remote workers. Remote workers can avoid fare hikes by staying home. Taxpayers are less likely to support mass transit systems that are underutilized.
Ridership demographics may exacerbate mass transit’s predicament. Riders skew poorer, while remote workers skew wealthier.28 So the riders most able to afford farebox and tax increases are also the most price sensitive and likely to opt out of mass transit entirely. Figure 7 illustrates the conundrum. The wealthier the household, the more likely that a member of it now works from home. Fortunately, most mass transit-related bonds are backed by sales taxes or other designated funding sources, not farebox revenues, but in a remote-work world, the trend for these systems is plainly negative.

- Cities. Remote work may change the composition of urban tax bases. Urban tax bases typically have a large commercial component, which may shrink as demand for office space wanes.29 Cities also typically lack affordable and spacious housing options, which make remote work comfortable.30 A period of adjustment seems likely. However, in the long-run, cities are likely to thrive even in a work-from-home economy. Cities offer cultural amenities and network effects that are hard to reproduce. Many were in solid financial condition entering the pandemic, and notwithstanding material risks, for now, commercial real estate capital spending is holding up better than after past recessions (Figure 8).31

- Higher ed issuers. Competition from remote learning alternatives is likely to further squeeze margins in the higher education space.32 More students may opt for non-traditional, remote learning arrangements, pressuring higher education bonds backed by narrow revenue streams like parking or housing fees.
- High-cost-of-living jurisdictions. Remote work may trigger outmigration from high-cost states by permanently altering the geographic bond between work and home. A U.S. Supreme Court case could accelerate these changes in 2021. In New Hampshire v. Massachusetts, New Hampshire accuses Massachusetts of unconstitutionally imposing Massachusetts income tax on New Hampshire residents who now work remotely but previously commuted to Massachusetts.33 A dozen states have joined the New Hampshire suit.34 If New Hampshire wins, it may establish that remote workers owe tax only (or mostly) where they live, driving more workers to lower cost regions.
Latent credit challenges remain entrenched. The pandemic is likely to delay progress addressing several macro credit risks, including pension-funding and the federal deficit, as well as environmental, social and governance (ESG) challenges like climate change and inequality.
- Pensions. While low interest rates have helped many issuers access funds to finance infrastructure during the pandemic, they have also placed new pressure on state and local pension plans. The average funding ratio for large state and local plans is expected to fall to 68 percent and 65 percent in 2025, respectively, from the current 72 percent and 71 percent.35 Most public plans assume asset returns near 7 percent.36 Generating returns of this sort is difficult when risk-free Treasuries yield 1 percent.
- Federal deficits. The pandemic has worsened projections for federal deficit and debt.37 Rising deficits may matter less in today’s chronically low-interest-rate world.38 But as a political matter, they can inhibit support for state and local grant aid. The Senate’s recent refusal to include state and local aid in the latest stimulus package illustrates the point. This decade, spending on mandatory entitlements will crowd out funding for state and local governments (and other discretionary programs) absent additional taxes or debt.39 Key entitlement programs will comprise 66 percent of non-interest spending by 2030 (Figure 9).

Climate change. Climate change continues to grow as a municipal credit issue. The term “climate change” appeared in over 1,000 public finance-related Moody’s publications in 2020.40 In January 2020, Intercontinental Exchange (ICE) and RisQ, a climate finance data provider, partnered to attach climate data to most CUSIPs in the municipal market.41 The incoming Biden administration has made climate policy a thematic foundation for its domestic and foreign policy strategies, with potential import for the municipal housing, transportation, and power sectors, among others. Climate-related risks infrequently result in ratings downgrades, but the incidence seems likely to rise. A recent example: in November 2020, S&P downgraded Trinity Public Utility District (CA) due to its “significant exposure to wildfire liability”.42
Inequality. The U.S. is likely to emerge from the COVID-19 pandemic with record household net worth, a stock market near record highs, and 13 percent of American households experiencing food scarcity.43 It is also likely to emerge with glaringly divergent health and K-12 educational outcomes, along geographic, racial, ethnic and class lines.44 Unequal wealth, health, and educational opportunities have long characterized the public finance landscape. However, the pandemic has heightened public awareness of these issues. Policymakers in many jurisdictions may discover a more contentious budget making atmosphere, partly centered on these inequities.
Market technicals
Against a backdrop of healing, but diverging, credit quality, overall supply (taxable and tax-exempt) is likely to increase modestly in 2021 while demand remains strong. Municipal yields are likely to remain very low, alongside Treasuries.
Supply. Published estimates for 2021 supply vary widely, ranging from $375 billion (Hilltop Securities) to $550 billion (Citibank). Varying supply estimates reflect the potential for significant taxable advance refunding volume depending on the path for interest rates. If rates stay low, taxable advance refundings are likely to remain a feature of the municipal market. Through November, taxable issuance comprised 31 percent of 2020 municipal bond volume (Figure 10).45 That is the second-highest proportion on record, below only the 35 percent peak in 2011 (the second year of the Build America Bonds program). The bulk of 2020 taxable issuance represents advance refundings, which were barred on an exempt basis by the Tax Cuts and Jobs Act (TCJA) in 2017.

In contrast to taxable supply, the tax-exempt market is likely to grow only modestly in 2021, and importantly, net tax-exempt supply is likely to be negative, meaning the supply of tax-free income is likely to decline during the year;46 more tax-free bonds will mature or be called via taxable advance refundings than will be issued. Notably, growth in new money borrowing is likely to remain tepid until the economy picks up speed in the second half of the year. As Figure 11 illustrates, state and local capital spending tends to retract during periods of recession.

The supply outlook could change if Democrats win both Georgia Senate races and/or the incoming Biden administration makes surprising progress on a large infrastructure bill in early 2021. Democrats in the House and Senate broadly support reinstating the Build America Bonds program as part of an infrastructure overhaul. Increased federal funding for a new, climate-related infrastructure program or the Highway Trust Fund might also spur more issuance.
Demand. Demand is likely to remain strong in 2021. Inflows into mutual funds rebounded strongly in the second half of 2020, and additional inflows seem likely in 2021, as investors gain comfort with the economic recovery.48 If rates rise during a period of unexpectedly strong 1Q or 2Q 2021 growth, an outflow cycle could ensue, but it would likely be temporary.
Secular trends that have defined the past several years remain in place, including the growing number of older investors who find value in the stability of a tax-free, high-grade income stream, fewer tax-advantaged asset classes post-TCJA, and a long-term bias toward higher tax rates; the federal government’s fiscal outlook (discussed above) threatens higher tax rates over a multi-year period. Note that if Democrats retake the Senate, federal tax rates could rise as soon as next year.
Demand for taxable municipals is likely to remain strong, as well. In particular, strong demand from foreign buyers remains in place. Very low (or negative) yields abroad creates a strong technical backdrop for high-grade, taxable municipals.
Yields and spreads to remain very low
We believe municipal yields and spreads are likely to remain historically low in 2021. Rates will likely stay tethered to Treasuries, and credit spreads should remain tight. Low investment grade municipals may outperform their high-grade peers in 2021, in a reversal of 2020 experience. As Figure 12 illustrates, A-rated spreads are near their decade lows while BBB-rated spreads remain higher than theirs, as reported by the Municipal Market Monitor.

We caution that this partly reflects weaker pricing for several pressured essential service issuers that dominate the BBB portion of the Barclays 1-10 Municipal Bond index, including Illinois, New Jersey, Chicago, and the NY MTA. Together, these names comprise over 53 percent of the BBBs in that index. We favor credit picking in 2021 and staying disciplined in the AA and A spaces.
[1] CDC COVID Data Tracker, as of Dec. 23, 2020 at 9am. Available at: https://covid.cdc.gov/covid-data-tracker/#vaccinations.
[2] For example, few can be sure how long vaccines will confer immunity, whether a new strain of the virus inhibits quick attainment of herd immunity, whether vaccines will be distributed as quickly as advertised, whether enough Americans will take them, or the extent to which global vaccination takes root (global inoculation is a precondition for significant growth in trade and international travel). But authorities now expect mass vaccinations to begin in early Q2-2020 and that an uptake rate of 75% or higher may permit a return to “normalcy” by the end of 2021. See the following links: https://news.harvard.edu/gazette/story/2020/12/anthony-fauci-offers-a-timeline-for-ending-covid-19-pandemic/#:~:text=Health%20%26%20Medicine-,Fauci%20says%20herd%20immunity%20possible%20by%20fall%2C%20'normality'%20by,of%20Allergy%20and%20Infectious%20Diseases.: https://news.gallup.com/poll/325208/americans-willing-covid-vaccine.aspx. https://www.economist.com/the-world-ahead/2020/11/16/the-covid-19-vaccination-programme-will-be-the-biggest-in-history.
[3] Duehren and Peterson, “Congress reaches Final Agreement on Pandemic Relief,” Wall Street Journal, December 21, 2020.
[4] In its December 16, 2020 statement, the FOMC announced that it would keep its target range for the federal funds rate at 0 to 0.25% and continue its monthly purchases of Treasuries ($80 billion) and agencies ($40 billion): https://www.federalreserve.gov/newsevents/pressreleases/monetary20201216a.htm.
[5] See polling average at FiveThirtyEight.com: https://projects.fivethirtyeight.com/georgia-senate-polls/?cid=rrpromo.
[6] The 2020 National League of Cities Fiscal Conditions Report highlights that many cities expect revenue declines and expenditure increases.
[7] State Housing Finance Agencies: “2021 outlook stable as loan sales offset forbearance and lower investment income,” Moody’s Investors Service, December 9, 2020.
[8] Moody’s Investors Service as of December 31, 2021.
[9] Conclusions based on Breckinridge analysis of data provided by Merritt Research Services. FY 20 early reporting systems include roughly 6% of water-sewer system and 10% of electric utility systems.
[10] “Traffic on Major U.S. Toll Road Systems Achieves Strong Recovery Toward Pre-Covid-19 Levels,” Conduent analysis, December 17, 2020. Available at: https://www.news.conduent.com/news/traffic-on-major-u-s-toll-road-systems-achieves-strong-recovery-toward-pre-covid-19-levels.
[11] “2021 outlook revised to stable as demand grows along with GDP and employment,” Moody’s Investors Service, December 3, 2020.
[12] For example, see: https://tracktherecovery.org/.
[13] See: http://www.msrb.org/News-and-Events/COVID-19-Information.aspx.
[14] “U.S. Public Finance 2020 Year in Review: One Like No Other,” Standard & Poor’s, December 10, 2020. The Moody’s sectors with a stable outlook include: water and sewer, public power, state housing finance agencies, and toll roads.
[15] Alan Greenblatt, “Absent Federal Aid, How Bad are State Budgets?” Govverning.com, December 22, 2020.
[16] “City Fiscal Conditions 2020,” National League of Cities, August 14, 2020.
[17] For example, for 135 large hospital systems tracked by Breckinridge, operating margins are slightly negative, but liquidity is “up” on account of significant debt issuance for cashflow needs. Breckinridge analysis of Merritt Research Services data, December 2020. Transportation borrowings refer to airport and toll road issuance, among obligors that we follow.
[18] See: State of New Jersey Covid-19 General Obligation Emergency Bonds, Series 2020A. Available at: https://emma.msrb.org/IssueView/Details/P2404643
[19] FY 21 Mid-Year State Budget Financial Plan Update, October 2020, p. 16. Available at: https://www.budget.ny.gov/pubs/press/2020/fy21-fp-midyear-update.html.
[20] See the Federal Reserve’s MLF term sheet: https://www.federalreserve.gov/monetarypolicy/muni.htm.
[21] Bureau of Labor Statistics, Labor Force Participation Rate - 55 Yrs. & Over, LNS11324230
[22] Bureau of Labor Statistics.
[23] California’s top personal income tax rate is 13.3%, and its state sales tax rate is 7.25%. Federation of Tax Administrators (for income and sales tax rates): https://www.taxadmin.org/current-tax-rates; Legislative Analyst’s Office for recent personal income tax estimates: https://lao.ca.gov/Publications/Report/4111.
[24] General Revenue and Selected State Tax Revenue Update. Available at: https://www.sbafla.com/bond/Financial-Information/Revenues-and-Estimates. Bureau of Labor Statistics for payroll figure.
[25] Gallup Poll, October 13, 2020.
[26] For corporate travel, a long recovery ahead, McKinsey, August 13, 2020: https://www.mckinsey.com/industries/travel-logistics-and-transport-infrastructure/our-insights/for-corporate-travel-a-long-recovery-ahead
[27] “Coronavirus (Covdi-19): Airport Balance Sheet Liquidity Blunts Pandemic Impact,” Kroll Bond Rating Agency, November 11, 2020.
[28] Monica Anderson, “Who relies on public transit in the U.S.,” Pew Research Center, April 7, 2016 and Mike Maciag, “Public Transportation’s Demographic Divide,” February 25, 2014.
[29] Since the pandemic began, rents in high-cost areas like New York City and San Francisco have softened while suburban real estate prices have risen faster than their urban peers. Roughly 35% of workers are interested in working remotely on a permanent basis. Gallup poll, October 13, 2020. Available at: https://news.gallup.com/poll/321800/covid-remote-work-update.aspx
[30] Zillow 2020 Urban-Suburban Market Report, August 12, 2020.
[31] In 2019, 76% of city finance directors reported they were “better able to meet their fiscal needs” than in the prior year. National League of Cities, City Fiscal Conditions 2019 Report. Available at: https://www.nlc.org/resource/city-fiscal-conditions-2019-report/.
[32] Higher Education Outlook, Moody’s Investors Service, December 8, 2020.
[33] The Supreme Court may not accept the case and could dismiss it on procedural grounds. See materials associated with New Hampshire v. Massachusetts, Supreme Court docket #220154. Available at: https://www.supremecourt.gov/docket/docketfiles/html/public/22o154.html.
[34] Stacie Sherman, “N.J. Challenges New York Tax on Residents Working Remotely,” Bloomberg, December 23, 2020.
[35] Aubry and Wandrei, “The Status of Local Government Pension Plans in the Midst of Covid-19,” Boston College Center for Retirement Research, August 2020.
[36] Boston College Center for Retirement Research, Public Plans Database.
[37] Congressional Budget Office (CBO) Projections, September 2020.
[38] Furman and Summers, “A Reconsideration of Fiscal Policy in the Era of Low Interest Rates,” November 30, 2020.
[39] Per the CBO, “other major health programs” include: Medicare, Medicaid, ACA subsidies, and the Children’s Health Insurance Program.
[40] Breckinridge analysis of Moody’s search filter tool on 12/22/20. Selection was for “climate change” and filters included only “US Public Finance” and the date range: 1/1/20 – 12/22/20.
[41] https://www.risq.io/2020/01/what-it-means-for-the-municipal-market/
[42] Trinity Public Utiltyi District, CA Electric Revenue Bond Rating Lowered to BBB+ from A- on Wildfire Liability, Standard & Poor’s, November 25, 2020.
[43] Federal Reserve Flow of Funds, December 2020, U.S. Census Household Pulse Survey, Week 20 (“Food Scarcity”), and S&P 500 index.
[44] Emma Dorn, Bryan Hancock, Jimmy Sarakatsannis, and Ellen Viruleg, “Covid-19 and learning loss – disparities grow and students need help,” McKinsey, December 8, 2020; Health Equity Considerations and Racial and Ethnic Minority Groups, July 24, 2020, Centers for Disease Control and Prevention: https://www.cdc.gov/coronavirus/2019-ncov/community/health-equity/race-ethnicity.html.
[45] Bond Buyer data through November 2020.
[46] For example, JP Morgan forecasts -$50 billion in net supply in 2021. See JP Morgan’s 2021 Municipal Outlook.
[47] See H.R. 2, the Moving Forward Act, proposed in July 2020.
[48] Lipper inflows had reached almost $36 billion, the fourth highest level on record in mid-December. JP Morgan.
DISCLAIMER
This material provides general and/or educational information and should not be construed as a solicitation or offer of Breckinridge services or products or as legal, tax or investment advice. The content is current as of the time of writing or as designated within the material. All information, including the opinions and views of Breckinridge, is subject to change without notice.
Any estimates, targets, and projections are based on Breckinridge research, analysis, and assumptions. No assurances can be made that any such estimate, target or projection will be accurate; actual results may differ substantially.
Past performance is not a guarantee of future results. Breckinridge makes no assurances, warranties or representations that any strategies described herein will meet their investment objectives or incur any profits. Any index results shown are for illustrative purposes and do not represent the performance of any specific investment. Indices are unmanaged and investors cannot directly invest in them. They do not reflect any management, custody, transaction or other expenses, and generally assume reinvestment of dividends, income and capital gains. Performance of indices may be more or less volatile than any investment strategy.
Performance results for Breckinridge’s investment strategies include the reinvestment of interest and any other earnings, but do not reflect any brokerage or trading costs a client would have paid. Results may not reflect the impact that any material market or economic factors would have had on the accounts during the time period. Due to differences in client restrictions, objectives, cash flows, and other such factors, individual client account performance may differ substantially from the performance presented.
All investments involve risk, including loss of principal. Diversification cannot assure a profit or protect against loss. Fixed income investments have varying degrees of credit risk, interest rate risk, default risk, and prepayment and extension risk. In general, bond prices rise when interest rates fall and vice versa. This effect is usually more pronounced for longer-term securities. Income from municipal bonds can be declared taxable because of unfavorable changes in tax laws, adverse interpretations by the IRS or state tax authorities, or noncompliant conduct of a bond issuer.
Breckinridge believes that the assessment of ESG risks, including those associated with climate change, can improve overall risk analysis. When integrating ESG analysis with traditional financial analysis, Breckinridge’s investment team will consider ESG factors but may conclude that other attributes outweigh the ESG considerations when making investment decisions.
There is no guarantee that integrating ESG analysis will improve risk-adjusted returns, lower portfolio volatility over any specific time period, or outperform the broader market or other strategies that do not utilize ESG analysis when selecting investments. The consideration of ESG factors may limit investment opportunities available to a portfolio. In addition, ESG data often lacks standardization, consistency and transparency and for certain companies such data may not be available, complete or accurate.
Breckinridge’s ESG analysis is based on third party data and Breckinridge analysts’ internal analysis. Analysts will review a variety of sources such as corporate sustainability reports, data subscriptions, and research reports to obtain available metrics for internally developed ESG frameworks. Qualitative ESG information is obtained from corporate sustainability reports, engagement discussion with corporate management teams, among others. A high sustainability rating does not mean it will be included in a portfolio, nor does it mean that a bond will provide profits or avoid losses.
Net Zero alignment and classifications are defined by Breckinridge and are subjective in nature. Although our classification methodology is informed by the Net Zero Investment Framework Implementation Guide as outlined by the Institutional Investors Group on Climate Change, it may not align with the methodology or definition used by other companies or advisors. Breckinridge is a member of the Partnership for Carbon Accounting Financials and uses the financed emissions methodology to track, monitor and allocate emissions. These differences should be considered when comparing Net Zero application and strategies.
Targets and goals for Net Zero can change over time and could differ from individual client portfolios. Breckinridge will continue to invest in companies with exposure to fossil fuels; however, we may adjust our exposure to these types of investments based on net zero alignment and classifications over time.
Any specific securities mentioned are for illustrative and example only. They do not necessarily represent actual investments in any client portfolio.
The effectiveness of any tax management strategy is largely dependent on each client’s entire tax and investment profile, including investments made outside of Breckinridge’s advisory services. As such, there is a risk that the strategy used to reduce the tax liability of the client is not the most effective for every client. Breckinridge is not a tax advisor and does not provide personal tax advice. Investors should consult with their tax professionals regarding tax strategies and associated consequences.
Federal and local tax laws can change at any time. These changes can impact tax consequences for investors, who should consult with a tax professional before making any decisions.
The content may contain information taken from unaffiliated third-party sources. Breckinridge believes such information is reliable but does not guarantee its accuracy or completeness. Any third-party websites included in the content has been provided for reference only. Please see the Terms & Conditions page for third party licensing disclaimers.